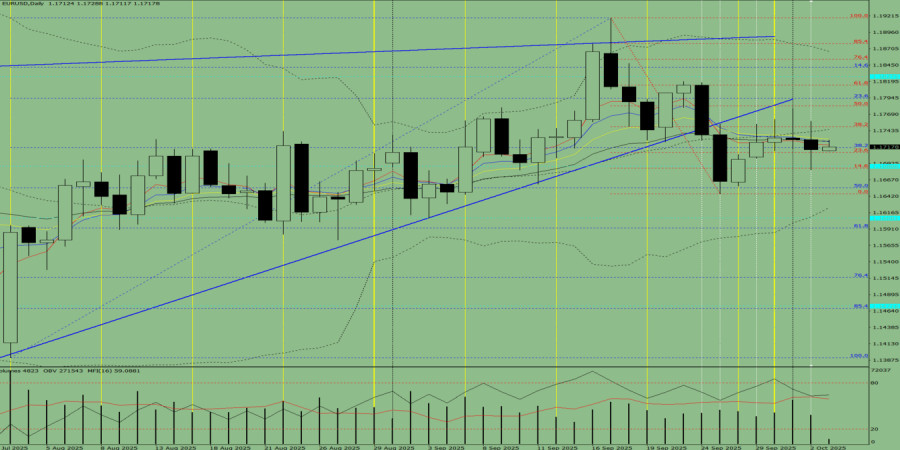
Trend Analysis (Fig. 1).
On Friday, from the level of 1.1714 (yesterday's daily candle close), the market may begin upward movement toward the target of 1.1782 – the 50% retracement level (red dashed line). When testing this level, a corrective downward move toward 1.1749 – the 38.2% retracement level (red dashed line) – is possible.
Fig. 1 (daily chart).
Comprehensive Analysis:
Overall conclusion: upward trend.
Alternative Scenario: Today, from the level of 1.1714 (yesterday's daily candle close), the price may begin upward movement toward the target of 1.1749 – the 38.2% retracement level (red dashed line). When testing this level, a corrective downward move toward 1.1717 – the 38.2% retracement level (blue dashed line) – is possible.

QUICK LINKS


 Contact Us

