The EUR/USD currency pair traded sideways for almost the entire Monday with low volatility, except for literally a few hours during the American trading session, when the price initially dropped sharply and then almost fully recovered. The drop in the euro could have been influenced by macroeconomic data (though this is not certain), as the Eurozone unemployment report turned out weaker than expected, while the ISM Manufacturing Index in the US was stronger. However, firstly, the timing of the dollar's rise and the two reports does not coincide, and secondly, if the market absorbed the macroeconomic releases, why did the euro recover by the end of the day? We believe that Monday's movements were purely technical. In recent weeks, there has been nearly flat movement with a minimal upward slope, and on Monday, we saw movements that fully aligned with this trend. Remember, in a flat, no grounds are needed for either growth or decline.
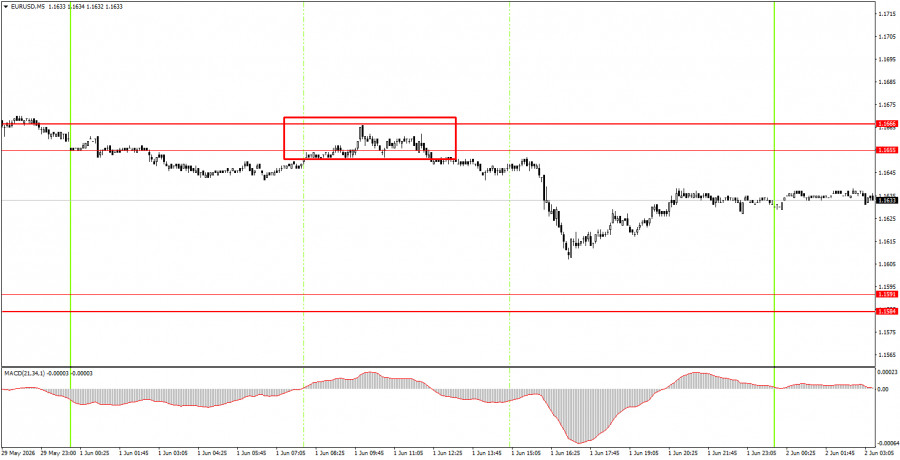
On the 5-minute timeframe on Monday, one trading signal was generated. During the European trading session, the price bounced from the area of 1.1655-1.1666 and then moved down by about 20-30 pips. By the end of the day, novice traders could have closed the short position with a small profit.
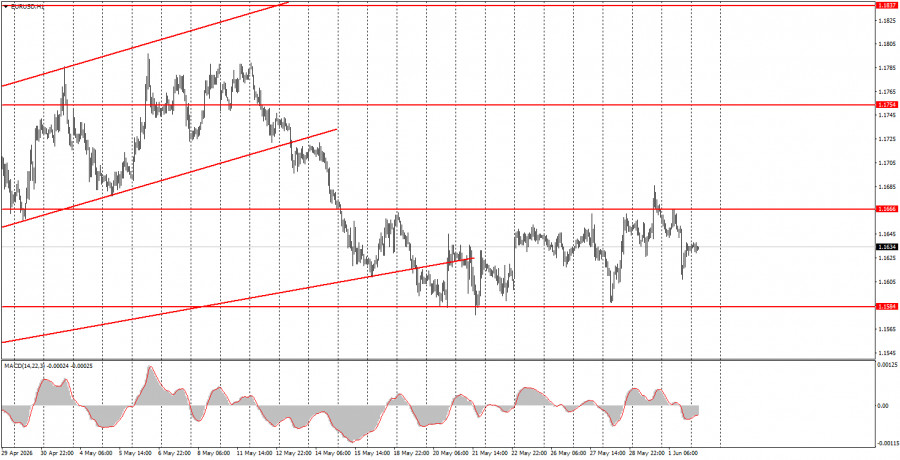
On the hourly timeframe, the euro has been in correction for a month and a half. The rise in the US dollar has resumed amid the conflict in the Middle East, which is on the verge of escalation, but we still do not expect prolonged growth in the US dollar. The market continues to largely ignore fundamentals and macroeconomics, while selectively reacting to geopolitics.
On Tuesday, beginner traders can open short positions targeting 1.1584-1.1591 if the price bounces from the 1.1655-1.1666 area. New buy trades can be considered upon the price consolidating above the area of 1.1655-1.1666, with a target of 1.1745-1.1754.
On the 5-minute timeframe, levels to consider include 1.1354-1.1363, 1.1413, 1.1455-1.1474, 1.1527-1.1531, 1.1584-1.1591, 1.1655-1.1666, 1.1745-1.1754, 1.1830-1.1837, and 1.1899-1.1908. On Tuesday, an important May inflation report for the Eurozone will be published, which could influence the European Central Bank's decisions at its next meeting. In the US, a less significant JOLTS report on job openings for April will be released. We doubt the market will react to the consumer price index, and we do not anticipate any significant changes in the pair's movement.
Price levels (areas) of support and resistance are targets when opening long or short positions or sources of signals.
Red lines indicate channels or trend lines that display the current trend and indicate the preferred direction for trading.
The MACD indicator (14,22,3) – histogram and signal line – is a supplementary indicator that can also be used as a source of signals.
Important speeches and reports (contained in the news calendar) can significantly impact the movement of the currency pair. Therefore, during their release, trading should be conducted with maximum caution, or one should exit the market to avoid sharp reversals against preceding movements.
Beginners trading in the forex market should remember that not every trade can be profitable. Developing a clear strategy and practicing money management are keys to success in trading over the long term.

QUICK LINKS


 Contact Us

