The EUR/USD currency pair attempted to continue the emerging upward correction on Friday; however, the European currency was unable to move significantly higher. There was no macroeconomic or fundamental backdrop on that day, so only geopolitical news is worth noting. However, based on the pair's movements, it did not particularly impress traders. Overall, it is currently extremely difficult to understand what factors are driving the currency market. We have seen a two-week rise in the US dollar that lacked sufficient justification or foundation. The tightening of views on the Federal Reserve's monetary policy is certainly a significant factor, but the market has worked through it for too long. Therefore, we do not believe that the dollar's success lies in it. Rather, the problem is again related to geopolitics, as Iran and the US have broken a second ceasefire, and the outcome of their conflict remains unknown. Thus, at present, we are paying more attention to technical factors.
Technically, the pair is located on the hourly timeframe below the Ichimoku indicator lines, so the trend is unequivocally downward. Overall, the euro has been falling for two months, despite the formal conclusion of the conflict in the Middle East, the formal opening of the Strait of Hormuz, falling oil prices, and the European Central Bank's monetary policy tightening. There is currently no trend line, and a long-term upward trend remains intact on higher timeframes.
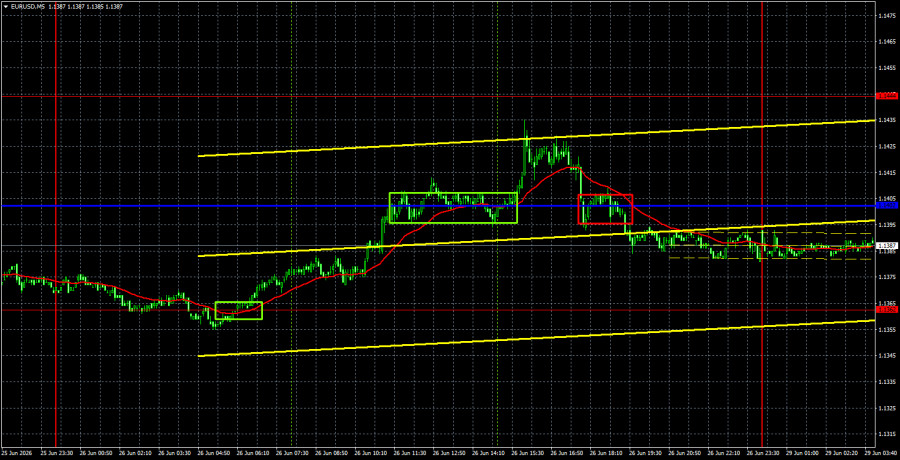
On the 5-minute timeframe, three trading signals were generated on Friday. Just before the opening of the European trading session, the price bounced off 1.1362, allowing long positions to be opened. Subsequently, the price broke above the Kijun-sen line. At the close of the day, it settled back below the critical line. It was unlikely that positions could be opened before the market closed, so traders could only open long positions in the morning. The trade turned out to be profitable.
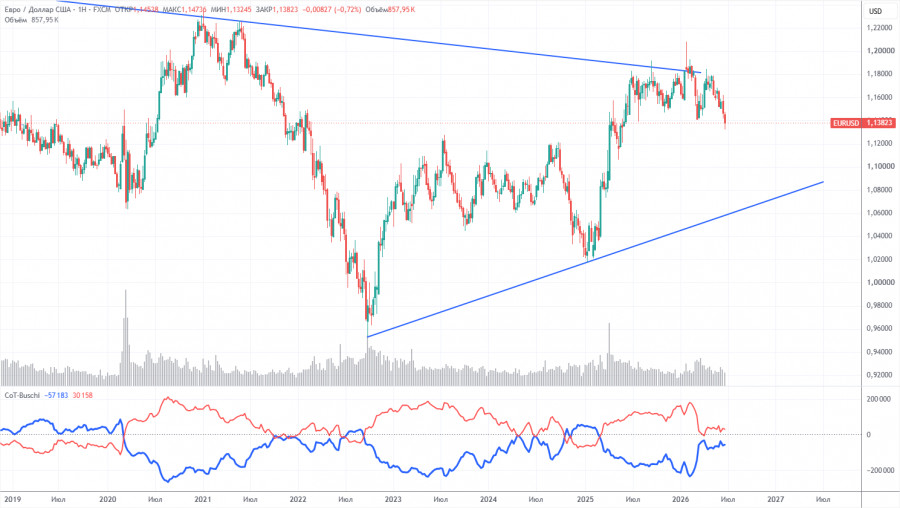
The latest COT report is dated June 23. The weekly timeframe illustration clearly shows that the net position of non-commercial traders remains "bullish" but has declined significantly due to geopolitical events. Traders have been getting rid of the euro in favor of the US dollar in recent months. Donald Trump's policy has not changed, but the dollar has acted as a "reserve currency" for some time. However, this process may have already come to an end.
We still do not see any fundamental factors that would strengthen the euro, while there are plenty of factors that could cause the dollar to decline. The war in the Middle East made the dollar temporarily super attractive, but when this factor's "shelf life" expires, everything will return to square one. And it may have already expired. In the long term, the euro could fall to as low as 1.08$ (the trend line), but the upward trend will still remain relevant. And in recent months, the pair has not come significantly closer to this line.
The position of the red and blue lines of the indicator indicates parity between bulls and bears. During the last reporting week, the number of longs in the "Non-commercial" group increased by 19,300, while the number of shorts increased by 23,500. Accordingly, the net position fell by 4,200 contracts over the week.
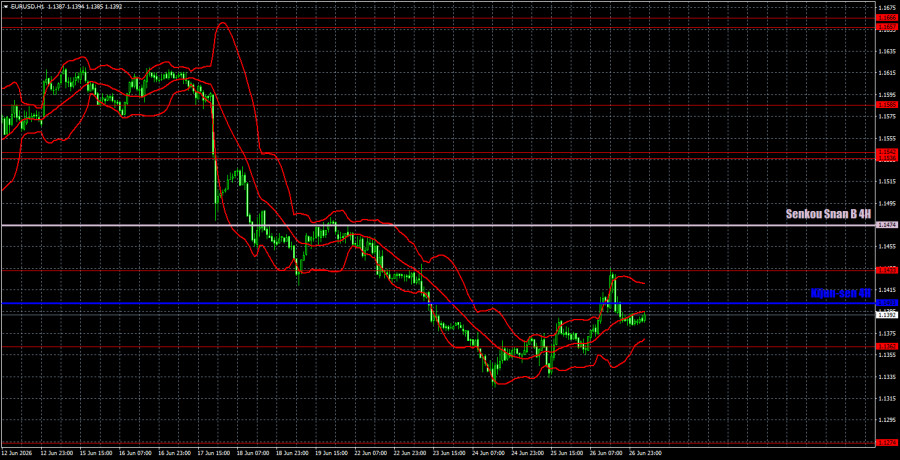
On the hourly timeframe, a strong, unfounded downward trend continues to develop. The situation in the Middle East remains tense, but we do not believe the ongoing shelling between Iran and the US is sufficient to cause the dollar to strengthen significantly. The Federal Reserve has supported the US currency, but it is difficult to say why the decline continues to this day. The market continues to buy dollars for no apparent reason, ignoring all factors in favor of the euro.
For June 29, we highlight the following levels for trading: 1.1234, 1.1274, 1.1362, 1.1433, 1.1536-1.1542, 1.1585, 1.1657-1.1666, 1.1750-1.1760, 1.1786, 1.1830-1.1837, as well as the Senkou Span B (1.1474) and Kijun-sen (1.1403) lines. The Ichimoku indicator lines may move throughout the day, which should be taken into account when determining trading signals. Do not forget to set the Stop Loss order to break even if the price moves in the correct direction by 15 pips. This will protect against potential losses if the signal proves false.
On Monday, the economic calendar contains nothing of interest except the speech by ECB President Christine Lagarde. Her position has softened lately, but overall, most members of the Monetary Committee support raising rates. However, this information does not influence traders.
Today, traders may consider short positions upon a bounce from the Kijun-sen line or upon settling below the level of 1.1362 with a target of 1.1274. Long positions can be opened with targets of 1.1433 and the Senkou Span B line, if the pair settles above the critical line.
Price support and resistance levels (resistance/support) are thick red lines around which movement may end. They are not sources of trading signals.
Kijun-sen and Senkou Span B lines are Ichimoku indicator lines transferred to the hourly timeframe from the 4-hour timeframe. They are strong lines.
Extreme levels are thin red lines from which the price has previously bounced. They are sources of trading signals.
Yellow lines are trend lines, trend channels, and any other technical patterns.
Indicator 1 on COT charts shows the size of the net position for each category of traders.


 コンタクトする

