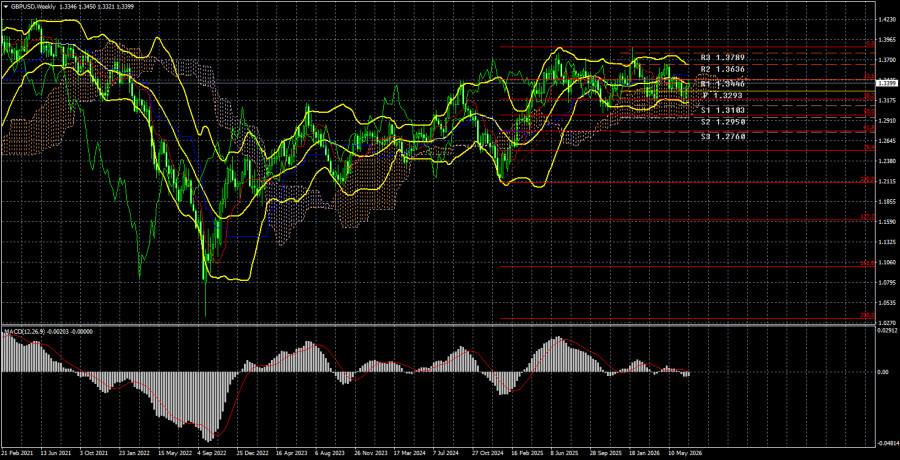
The GBP/USD currency pair has gained nearly 300 pips over the last two weeks. In our recent reviews, we continuously noted that the last round of decline was illogical, and the subsequent growth has been influenced by two important factors. The first is the recovery of justice, as the British pound had no grounds for such a strong decline in recent months. The second is technical, as a sideways channel has persisted on the weekly timeframe for a whole year. Thus, after testing its lower boundary, the price began to move toward the upper boundary. It is also worth mentioning the Fibonacci level of 38.2%. The European currency corrected by 38.2%, and the British pound by the same amount. The movements are slightly different, but in the long term, they are virtually identical.
Thus, both major currency pairs maintain bullish prospects for the next few years. In the coming weeks, a rise to 1.3700 is expected, with the upper boundary of the sideways channel located there. What factors could help or hinder the British pound from rising another 300 pips?
Geopolitics. In our view, the market will no longer react to every local event. The failure of yet another round of negotiations, the lack of progress on key issues, new ceasefire violations, and new missile strikes—none of this provokes a market reaction anymore. Traders may respond only to a complete resumption of war or to a full, long-term peace.
Monetary Policy of Central Banks. Currently, there are more questions about the monetary policy of the Bank of England and the Federal Reserve than answers. The Fed shows readiness to tighten policy but is not rushing into this decision, hoping for a slowdown in inflation against the backdrop of falling oil prices. Next Tuesday, the June consumer price index will be released, and we will find out whether the Fed's expectations are justified. As for the Bank of England, it is not preparing for a rate hike, although it expects inflation to accelerate in the second half of 2026. Thus, at the next meeting, neither central bank intends to raise rates; therefore, the dollar and the pound are on equal footing.
Macroeconomic Data have a rather indirect impact on traders' sentiment in 2026. Therefore, we should not expect a strong market reaction to the next report (even if it is important). Volatility in the pound sterling has also been quite low in recent weeks, indicating how actively the market wants to trade right now.
Let us remind you that a flat is a period of accumulation or distribution of positions by major players for the future. In simpler terms, any flat is a calm before a new trend. In which direction should we expect the new trend? In our opinion, only upward. The dollar has no long-term growth prospects, and the British pound has been in a downward trend for about 16 years. We believe that the upward movement may continue, even on purely technical grounds.
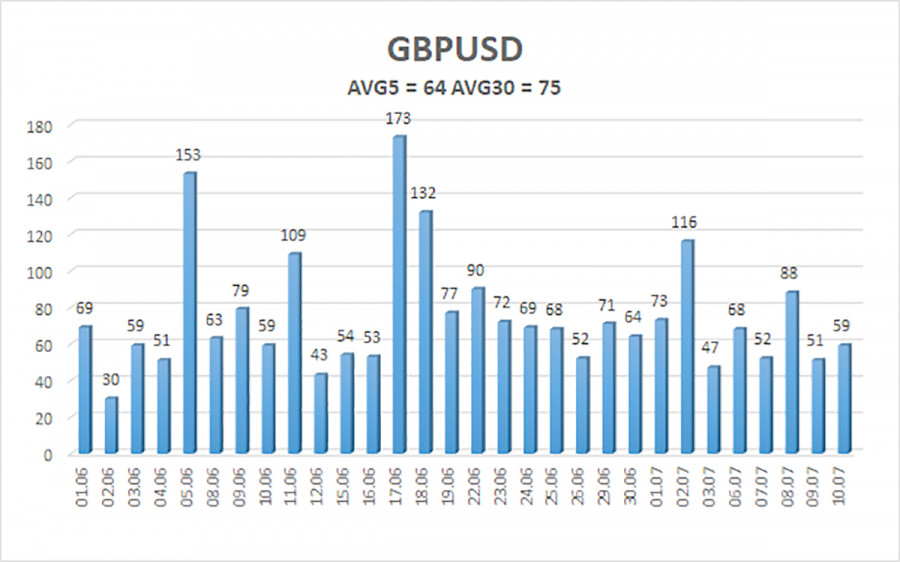
The average volatility of the GBP/USD pair over the last 5 trading days is 64 pips. For the pound/dollar pair, this value is considered "medium-low." On Monday, July 13, we thus expect movement within the range limited by the levels of 1.3335 and 1.3463. The upper channel of linear regression is directed downward, indicating a downward trend. The CCI indicator has entered oversold territory twice and formed two bullish divergences, warning of the end of the downward trend, but it has now formed a new bearish divergence.
S1 – 1.3367
S2 – 1.3306
S3 – 1.3245
R1 – 1.3428
R2 – 1.3489
R3 – 1.3550
The GBP/USD currency pair maintains a downward trend. Donald Trump's policies will continue to exert pressure on the U.S. economy, so we do not expect growth in the U.S. dollar in the long term. The year 2026 is proving super-positive for the dollar due to geopolitics and, more recently, the Fed's readiness to raise the key interest rate. However, there remains a flat area on the weekly timeframe between 1.3150 and 1.3780, within a four-year upward trend. Long positions with targets of 1.3428 and 1.3463 can be considered when the price is above the moving average. A price position below the moving average line allows for trading downwards with a target of 1.3245.
Linear regression channels help determine the current trend. If both are directed in the same way, then the trend is currently strong;
The moving average line (settings 20,0, smoothed) determines the short-term trend and the direction in which trading should be conducted;
Murray's levels are target levels for movements and corrections;
Volatility levels (red lines) indicate the likely price channel in which the pair will move in the coming days, based on current volatility indicators;
The CCI indicator—its entry into oversold territory (below -250) or overbought territory (above +250) indicates that a trend reversal in the opposite direction is approaching.




















 コンタクトする