Podle Bernsteina má nejlepší pozici, aby se stala vedoucí alternativou k Taiwan Semiconductor Manufacturing (NYSE:TSM), společnost Samsung (KS:005930), nikoli Intel (NASDAQ:INTC).
Makléřská společnost uvedla, že oznámená spolupráce Samsungu s Teslou v oblasti čipů v hodnotě 16,5 miliardy dolarů podporuje její dlouhodobý názor, že „svět potřebuje kromě TSMC dalšího předního výrobce logických polovodičů a že Samsung… má lepší pozici než Intel, aby se stal touto alternativou“.
Ačkoli projekt čipu Tesla AI6 může nakonec přesáhnout automobilové aplikace, Bernstein odhaduje, že roční tržby Samsungu z této dohody dosáhnou maximálně 2–2,5 miliardy dolarů, přičemž celkový příspěvek za celou dobu trvání dohody bude činit přibližně 8 miliard dolarů, což je výrazně méně než uváděných 16,5 miliardy dolarů.
Komentáře Elona Muska však naznačují potenciální širší využití, možná v robotice nebo jiných zařízeních.
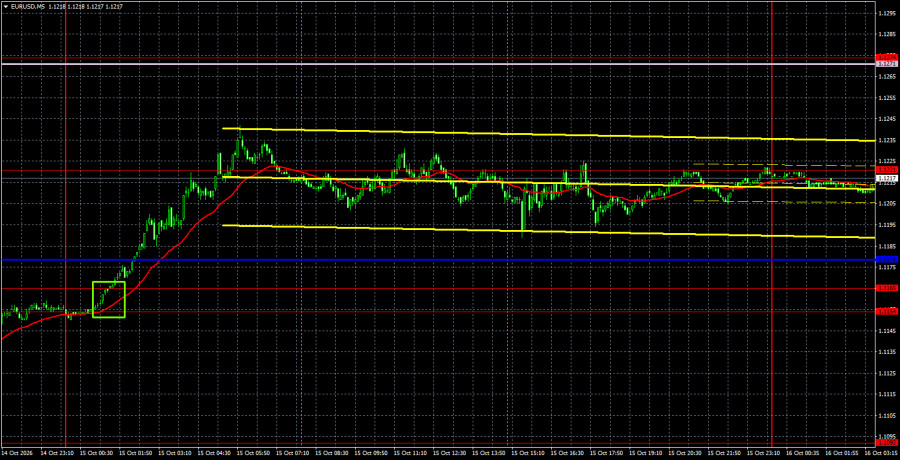
The EUR/USD pair recovered quite well overnight on Thursday after Wednesday's collapse on US data, and we view this recovery as a positive signal. First, the pair has finally decisively broken the trendline. Second, the euro showed a more or less confident rise for the first time in a month. Third, the US dollar cannot rise forever, day after day. Fourth, the market has already priced in the dollar's bullish factors. Fifth, the pair needs a correction after a month-long decline. Thus, a meaningful correction may be beginning now—at best, an uptrend on the hourly chart. Yesterday's macro backdrop had no visible effect on trader sentiment, which again shows that traders are largely ignoring reports and releases. Eurozone industrial production was weak, yet the euro did not fall, which had not been the case in recent weeks. Both US reports could have triggered renewed dollar strength, but they did not. We especially note the US PPI, an inflation measure — if inflation rises, the logic is "the Fed will be more hawkish, buy the dollar." Yesterday that chain of logic did not work.
Technically, the downtrend may be complete, since the trendline has been breached. The market bought the dollar for five weeks on any pretext, but every story ends. The euro is now heading toward the Senkou Span B line. We believe price must clear that line to start a sustained uptrend.
On the 5-minute chart, price bounced several times from 1.1221 on Thursday, offering traders short positions. However, price traded mostly sideways with minimal volatility during the day. Therefore, none of the intraday signals produced profits — nor losses — since price could not close above 1.1221.
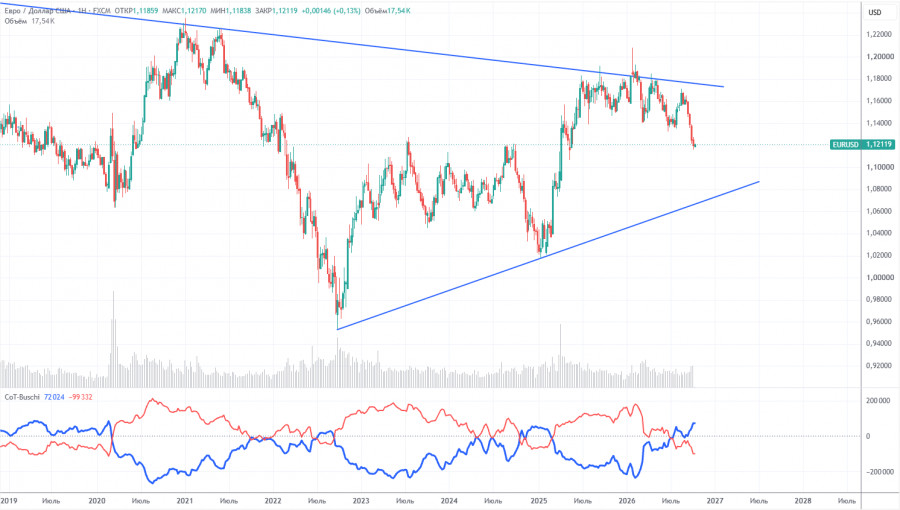
The latest COT report is dated October 6. The weekly timeframe illustration clearly shows that the net position of non-commercial traders remains "bearish" and has declined significantly in 2026 due to geopolitical events. Traders have been reducing euro exposure in favor of the US dollar over the past six months. Trump's policies have not changed, but the dollar has long served as a "reserve" currency.
However, we still do not see any fundamental factors that would further strengthen the US currency. The war in the Middle East made the dollar temporarily super-attractive, and the Federal Reserve's monetary policy stance surprised the dollar for the second time this year. In the long term, the euro could fall as low as $1.08 (the trendline), but the uptrend will remain relevant. Yet in recent weeks the market accounts only for positive factors for the dollar and ignores everything else.
The positioning of the red and blue indicator lines points to an approximate parity between bulls and bears. During the last reporting week, long positions in the "Non-commercial" group increased by 4,800, while shorts rose by 40,900. Accordingly, the net position decreased further by 36,100 contracts over the week.
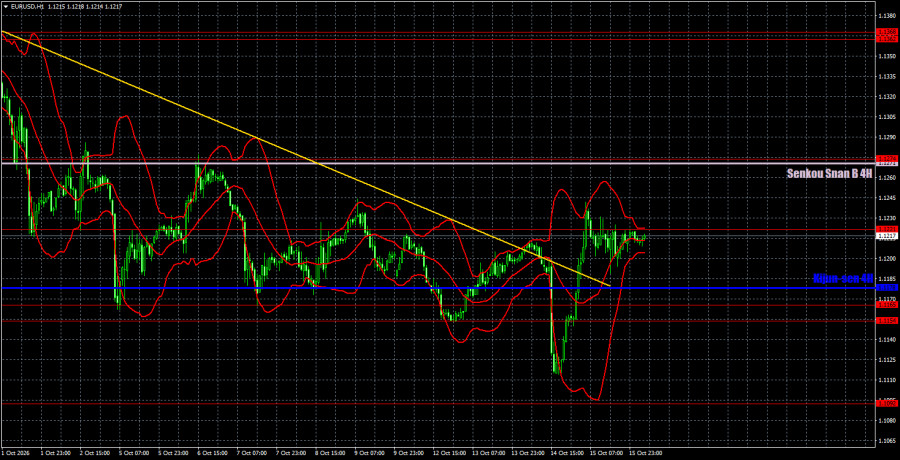
On the hourly timeframe, the EUR/USD pair finally has the opportunity to form an uptrend. If you also look at the daily and weekly timeframes, it becomes clear—the odds of a strong, lasting trend remain high. Throughout 2026, "black swans" aided the dollar and arrived in the market almost in flocks. However, any long-term rise in the dollar is a correction. Perhaps that correction is now complete?
For October 16 we highlight the following levels for trading — 1.1092, 1.1154–1.1165, 1.1221, 1.1274, 1.1362–1.1368, 1.1461–1.1473, 1.1536–1.1542, 1.1585, 1.1657–1.1665, as well as Senkou Span B (1.1271) and Kijun-sen (1.1178). The Ichimoku lines may shift during the day, so account for this when determining trading signals. Don't forget to move your Stop Loss to breakeven once price has moved 15 pips in the correct direction. This will protect against potential losses if the signal proves false.
On Friday, the Eurozone will publish the second estimate of inflation, which is unlikely to differ from the preliminary reading. In the US, Fed chair Kevin Warsh will speak (which could be market-moving), and the industrial-production report will be released (which is unlikely to attract much attention).
Traders may consider targets for short positions near 1.1178 and 1.1165 if price rebounds from 1.1221. If price breaks above 1.1221, consider targets for long positions in the 1.1271–1.1274 area.





















 コンタクトする