S&P Global Ratings revidovala výhled společnosti Nine Energy Service Inc (NYSE:NINE) ze stabilního na negativní, přičemž potvrdila rating emitenta „CCC+“.
Ratingová agentura očekává, že americký poskytovatel služeb pro ropná pole vykáže v roce 2025 záporný volný provozní cash flow (FOCF), a to i přes meziroční nárůst tržeb o 6 % a mírné zlepšení marže EBITDA v prvním čtvrtletí.
S&P jako klíčové faktory svého rozhodnutí uvádí očekávané zpomalení vrtných a dokončovacích prací v USA a pravděpodobné snížení marží v zbývajících třech čtvrtletích roku. Zadluženost společnosti, jejíž poměr provozních prostředků k dluhu činí přibližně 5 % a poměr dluhu k EBITDA přesahuje 5x, je považována za neudržitelnou.
Negativní výhled odráží možnost snížení ratingu, pokud se likvidita společnosti Nine zhorší do té míry, že by mohla v příštích 12 měsících nesplnit splátku úroků nebo porušit finanční závazek.
Provozní výsledky společnosti Nine jsou úzce spojeny s počtem vrtných souprav v USA, který meziročně poklesl přibližně o 5 %. Analytici S&P se domnívají, že počet vrtných souprav v USA by mohl dále klesat, pokud ceny ropy zůstanou na úrovni kolem 60 USD za barel.
The EUR/USD currency pair continued to trade very weakly and reluctantly on Monday. This is not surprising, as according to the Catholic calendar, April 6 is Easter Monday. Firstly, it is a holiday. Secondly, by April 6, Donald Trump could have given the order for a new air operation in Iran. As a result, traders were not inclined to open positions from the beginning.
After several weeks, it can be confidently said that the market has not rushed to buy or sell the dollar for quite some time. We have regularly stated that no matter how strong the geopolitical factor is, the market cannot constantly react to it. The war between Ukraine and Russia has been going on for five years, yet no one among investors and traders is overly concerned about it anymore. Initially, military actions in Eastern Europe significantly impacted oil prices and oil flows. Therefore, we believe that geopolitics has started to recede into the background. For now, it's just the initial stage of this retreat, as the macroeconomic background continues to be ignored by the market. However, we no longer see daily dollar growth, even though the situation in the Middle East is not improving.
In our view, the market is not in a wait-and-see position but rather in a last hope position. Trump has postponed the final deadline for Iran to open the Strait of Hormuz for the third time. This deadline now expires today at 8:00 PM Eastern Time. What will happen next is likely something everyone can guess. Iran continues to hold its position and is not prepared to make any concessions. We hear about negotiations between Tehran and Washington only from Trump's lips, but it's difficult to believe in the existence of negotiations when Trump threatens total destruction of Iran almost every day.
We believe that in these circumstances, it is best to rely on fortune-telling with coffee grounds. Trump's actions are impossible to predict, and Iran does not confirm the presence of negotiations. Numerous insider reports often contradict each other, as every journalist has their own source, and sources share vastly differing information. Therefore, as before, it is best to wait for reliable information and work with it.
We would like to remind you that, at this time, all fundamental, macroeconomic, and technical factors are of no significance. The price has been swinging up and down in recent weeks, not because it is in a range, but because the geopolitical backdrop is constantly changing—approximately every two days. This is one of those rare cases where sideways movement fully reflects the news background.
Regarding the medium-term outlook for the EUR/USD pair, we still believe that if the conflict in the Middle East concludes soon, the European currency will resume its rise and quickly return to this year's highs. The dollar's only chance lies in further escalation in the Middle East.
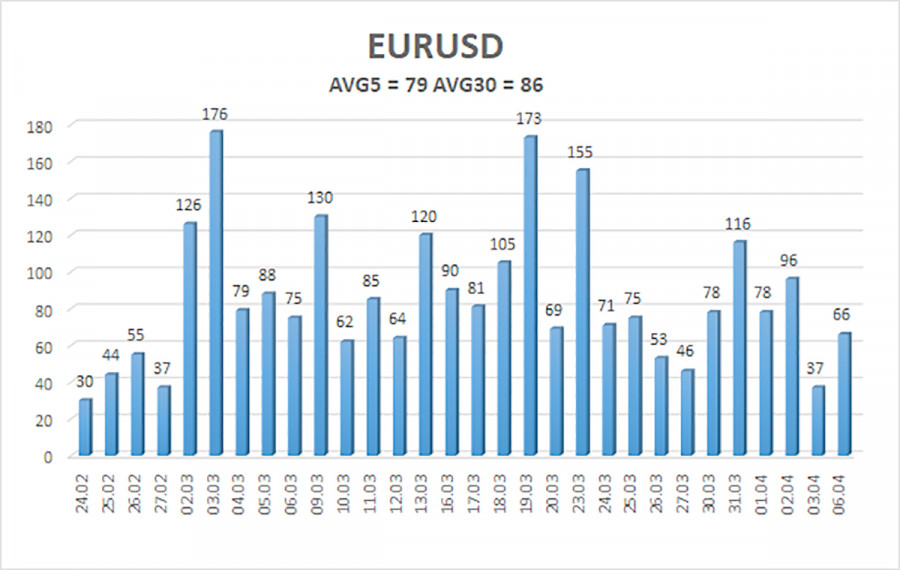
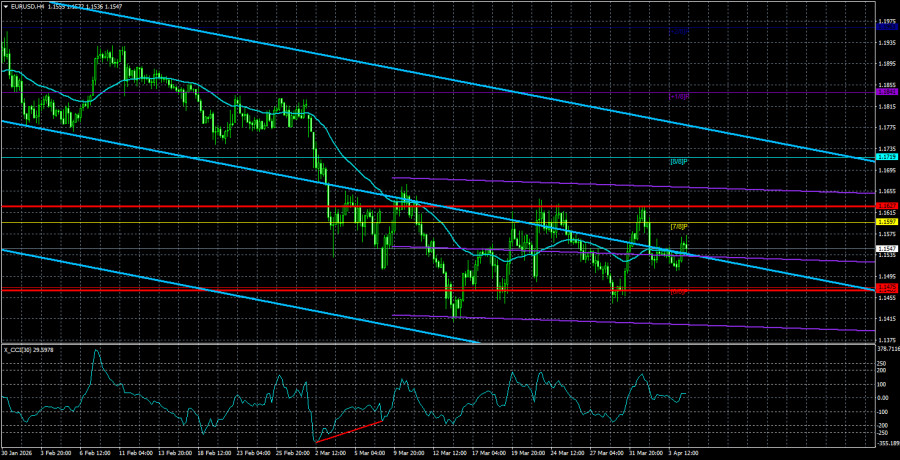
The average volatility of the EUR/USD currency pair over the last 5 trading days as of April 7 is 79 pips, which is considered "average." We expect the pair to trade between 1.1469 and 1.1627 on Tuesday. The upper linear regression channel has turned downward, indicating a change in trend. The CCI indicator has entered the oversold area and has formed a "bullish" divergence, which serves as another warning of the potential completion of the downward trend.
The EUR/USD pair continues its downward movement, driven by geopolitical factors. The global fundamental backdrop for the dollar remains extremely negative; however, for over a month, the market has focused solely on geopolitics, making all other factors practically irrelevant. If the price is below the moving average, short positions can be considered with targets of 1.1475 and 1.1353. Above the moving average line, long positions are relevant with targets of 1.1627 and 1.1719. For a stronger upward movement, the geopolitical backdrop needs to begin stabilizing.

ລິ້ງດ່ວນ


 ຕິດຕໍ່ພວກເຮົາ

