Akcie německého softwarového gigantu SAP klesly o přibližně 2,3 % poté, co společnost oznámila meziroční nárůst tržeb o 9 % na 9,03 miliardy eur (10,6 miliardy dolarů), což je méně než konsensus odhadů LSEG ve výši 9,08 miliardy eur. Provozní zisk mírně překonal odhady a dosáhl 2,57 miliardy eur, což představuje meziroční nárůst o 32 %.
Největší evropská společnost kótovaná na burze potvrdila svůj výhled na celý rok 2025, přestože upozornila, že „převládající dynamické prostředí s sebou nese vysokou míru nejistoty a sníženou viditelnost“. SAP také upozornil, že silný euro vůči americkému dolaru má negativní dopad na vykázané údaje o růstu tržeb.
Finanční ředitel Dominik Asam v pořadu „Europe Early Edition“ televize CNBC uvedl, že makroekonomická volatilita v důsledku celní politiky USA vedla zákazníky ke zpomalení rozhodování, ale že „určitou naději“ mu dává obchodní dohoda s Japonskem oznámená v úterý.
Analytici Deutsche Bank označili růst aktuálních objednávek SAP v oblasti cloudových služeb za „silný“ a uvedli, že společnost i přes výzvy „pokračuje ve velmi dobré výkonnosti“.
The EUR/USD pair showed no notable movement on Monday, which is hardly surprising given the near-complete absence of news, events, and macroeconomic publications. In Monday's articles, we warned that the only report for the day on German inflation was unlikely to elicit any emotional reaction from the market. Inflation remains an important indicator on which the European Central Bank's monetary policy depends. However, European inflation is the main concern, and Germany is just one country in the European Union, albeit the one with the strongest economy. German inflation may be declining or low, but in other less-developed economies it could be much higher. Thus, overall European inflation may differ significantly from German inflation.
In August, German inflation accelerated to 2.9%, although forecasts had anticipated a rise to 3%. Therefore, inflation in Germany is rising; however, the pace is slower than expected. But let's reiterate that the assessment should be based on European inflation, not just German inflation. That's exactly what the market did.
Also, on Monday, it became known that the U.S. struck Iranian targets for the first time in over a month, which was immediately met with a response from Tehran. Some may think that this scenario signals a new escalation of the conflict, but we believe that the market is no longer unsettled by such developments. What is surprising about Iran and Washington exchanging strikes for the seventh month of conflict in the Middle East? Moreover, negotiations have not taken place for over a month, and there is currently no chance of peace or a ceasefire, while the Strait of Hormuz remains closed. Thus, new strikes in the region elicit no emotional reactions, nor should they.
Geopolitics has long only interested traders through the lens of oil prices. Oil prices determine inflation worldwide, and inflation dictates central bank monetary policy actions. Thus, the geopolitical conflict in the Middle East is currently only relevant in light of the dynamics of "black gold" prices. What can be expected from "black gold" if the Strait of Hormuz remains closed and the conflict is much closer to a prolonged blockade of the strait and the Bab-el-Mandeb Strait than to peace and reopening?
The dollar managed to rise slightly in the last few days, but this week it faces a new series of challenges. Specifically, through business activity indexes, the August Nonfarm Payrolls report, the unemployment rate, and a series of reports on the U.S. labor market. If key American reports do not show poor values again and inflation in the Eurozone rises within normal limits, the dollar may see additional growth. However, any dollar growth remains purely corrective for us.
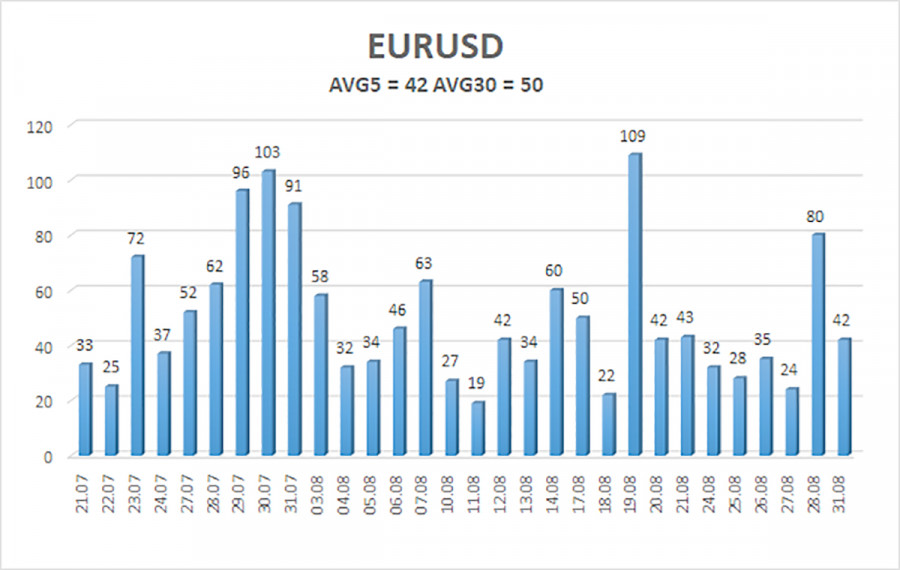
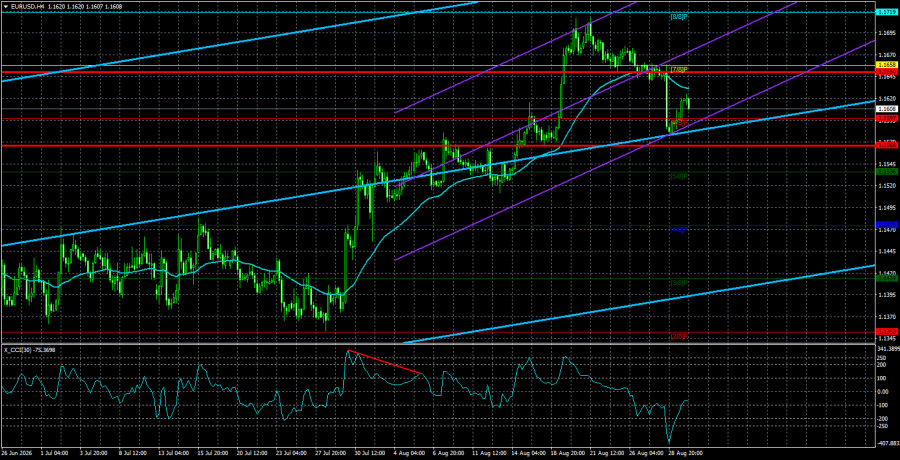
The average volatility of the EUR/USD currency pair over the last 5 trading days as of September 1 is 42 pips and is characterized as "low." We expect the pair to move between 1.1566 and 1.1650 on Tuesday. The upper channel of the linear regression has turned upward, indicating the beginning of an upward trend. The CCI indicator has entered oversold territory, signaling a possible end to the correction.
S1 – 1.1597
S2 – 1.1536
S3 – 1.1475
R1 – 1.1658
R2 – 1.1719
R3 – 1.1780
The EUR/USD pair continues its upward trend on the 4-hour timeframe, which may signal the beginning of a new phase of the global uptrend on higher timeframes. The global fundamental backdrop for the dollar remains negative, but in 2026, first geopolitics and then the Federal Reserve's hawkish stance provided powerful support for the American currency. However, at this moment, these factors are no longer supporting the dollar. If the price is below the moving average, short positions can be considered on a corrective basis with targets at 1.1566 and 1.1536. Above the moving average, long positions remain relevant with targets of 1.1719 and 1.1780.
Regression channels help determine the current trend. If both are directed in the same direction, it means the trend is currently strong.
The moving average line (settings: 20, 0, smoothed) defines the short-term trend and the direction in which trading should currently be conducted.
Murray levels are target levels for moves and corrections;
Volatility levels (red lines) indicate the likely price channel within which the pair will trade over the next 24 hours, based on current volatility indicators.
The CCI indicator — its entry into the oversold area (below -250) or the overbought area (above +250) indicates that a trend reversal in the opposite direction is approaching.

ລິ້ງດ່ວນ



















 ຕິດຕໍ່ພວກເຮົາ