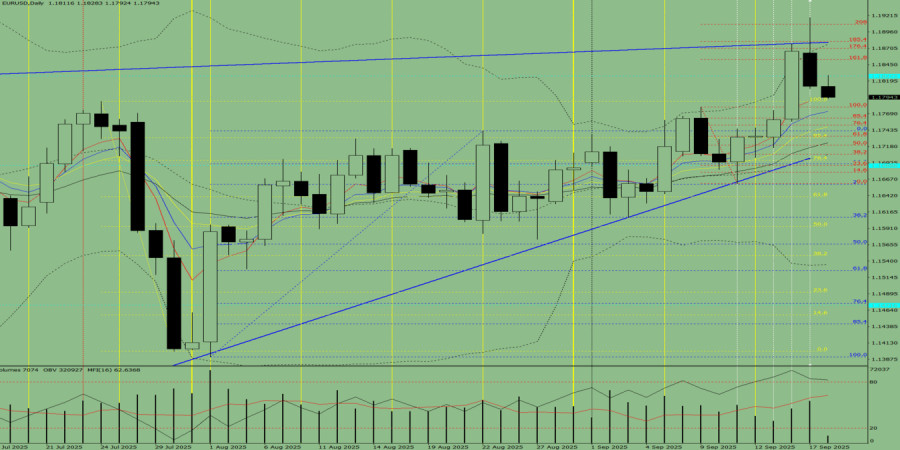
Trend analysis (Fig. 1).
On Thursday, from the 1.1812 level (yesterday's daily candle close), the market may continue moving downward toward the target of 1.1762 – the 85.4% pullback level (red dotted line). Upon testing this level, the price may rebound upward toward 1.1779 – the upper fractal (red dotted line).
Fig. 1 (daily chart).
Comprehensive analysis:
General conclusion: bearish trend.
Alternative scenario: on Thursday, from the 1.1812 level (yesterday's daily candle close), the market may continue moving downward toward 1.1779 – the upper fractal (red dotted line). Upon testing this level, the price may rebound upward toward 1.1828 – the historical resistance level (blue dotted line).

فوری رابطے


 ہم سے رابطہ کریں

