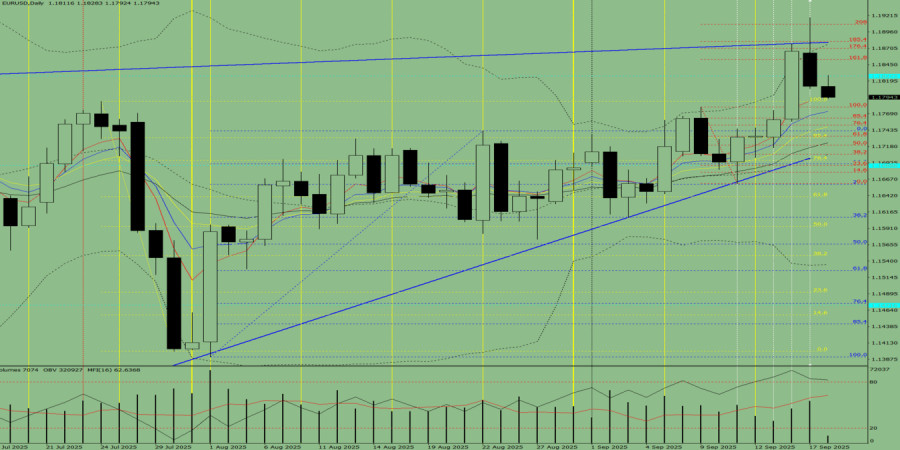
Trend analysis (Fig. 1).
On Thursday, from the 1.1812 level (yesterday's daily candle close), the market may continue moving downward toward the target of 1.1762 – the 85.4% pullback level (red dotted line). Upon testing this level, the price may rebound upward toward 1.1779 – the upper fractal (red dotted line).
Fig. 1 (daily chart).
Comprehensive analysis:
General conclusion: bearish trend.
Alternative scenario: on Thursday, from the 1.1812 level (yesterday's daily candle close), the market may continue moving downward toward 1.1779 – the upper fractal (red dotted line). Upon testing this level, the price may rebound upward toward 1.1828 – the historical resistance level (blue dotted line).

HIZLI BAĞLANTILAR
show error
Unable to load the requested language file: language/turkish/cookies_lang.php
date: 2025-09-18 11:03:59 IP: 216.73.216.38


 Bize Ulaşın

