Analiza rynku

Przeglądy analityczne ForexMart dostarczają aktualnych informacji na temat rynku finansowego. Przeglądy te zawierają informacje o trendach rynkowych, prognozach finansowych, raportach ekonomicznych i wiadomościach politycznych, które mają wpływ na rynek.

Disclaimer:  ForexMart nie udziela rekomendacji inwestycyjnych, a dostarczone materiały analityczne nie gwarantują przyszłych wyników.

How to Trade the GBP/USD Currency Pair on November 27? Simple Tips and Trade Analysis for Beginners
23:52 2025-11-26 UTC--5
Analiza kursów walut

Analysis of Wednesday's Trades:

1H Chart of the GBP/USD Pair

The GBP/USD pair also traded higher on Wednesday, though there were few compelling reasons for the move. The only significant macroeconomic report of the day (durable goods orders in the U.S.) was positive (and prompted a rise in the dollar), while the publication of the final budget draft for 2026 in the UK cannot clearly be described as positive (though it's possible to find a silver lining in any barrel of tar). Nevertheless, by the end of the day, the British pound appreciated. We have repeatedly warned that much of the GBP/USD pair's decline over the past two months has been illogical. In other words, a total decline that was half as much would have been considerably more reasonable. The pound has fallen for various reasons, and even without them. The U.S. dollar has not gained any new reasons to rise in the medium term over the past two months. Furthermore, the upward trend remains on the daily timeframe, so we were expecting growth in any event. It may be that the moment for resuming the global trend has arrived.

5M Chart of the GBP/USD Pair

analytics6927c89fe2a5c.jpg

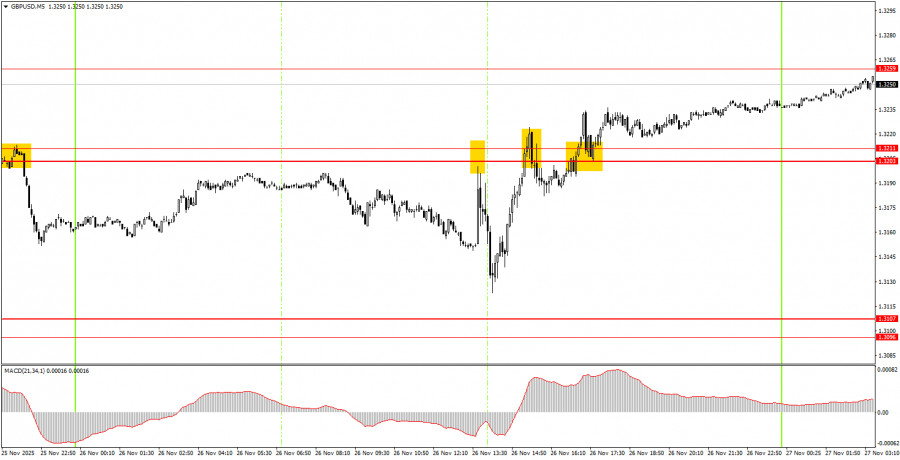
On the 5-minute timeframe, several trading signals were generated yesterday, but none of them left much to be desired, as the macroeconomic and fundamental backdrop led to price fluctuations in various directions. The price bounced twice from the 1.3203-1.3211 area, with the second bounce proving false, and then broke above it. Essentially, only the third trading signal was profitable, while the first trade closed at breakeven.

How to Trade on Thursday:

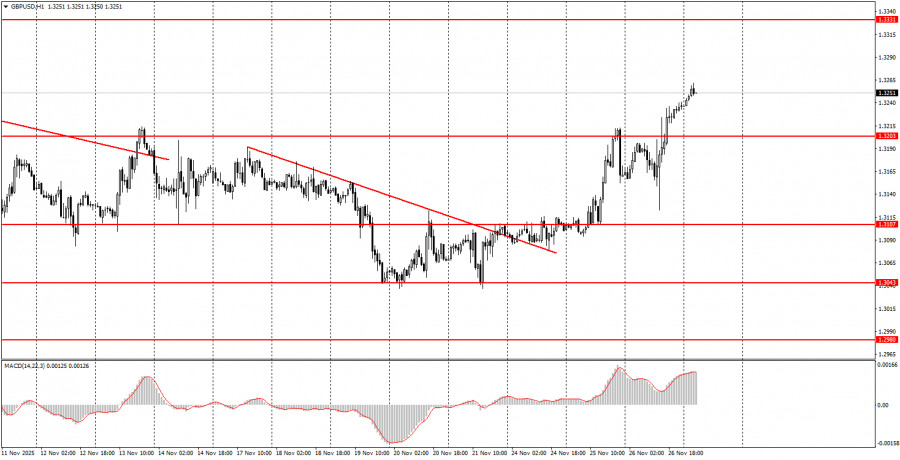
On the hourly timeframe, the GBP/USD pair has completed another downward trend. An upward movement has begun, and we hope it won't end as quickly as all the previous trends on the hourly timeframe. As we've noted, there are no global grounds for a prolonged dollar growth, so in the medium term, we expect movement only to the upside. The correction/flat on the daily timeframe may not be over yet, but any local trend on the hourly timeframe is potentially a resumption of the global trend.

On Thursday, beginner traders can expect new trading signals to form around the 1.3259 level. A bounce from this level would allow for short positions targeting 1.3211, while consolidation above it would support long positions with targets at 1.3329-1.3331.

On the 5-minute timeframe, trading can currently be done at levels: 1.2913, 1.2980-1.2993, 1.3043, 1.3096-1.3107, 1.3203-1.3211, 1.3259, 1.3329-1.3331, 1.3413-1.3421, 1.3466-1.3475, 1.3529-1.3543, 1.3574-1.3590. On Thursday, there are no significant events or reports scheduled in the UK or the U.S. Thus, market movements today may be weak, but if the global trend has resumed, the British pound could continue to appreciate.

Key Principles of My Trading System:

  1. The strength of the signal is considered based on the time taken to form the signal (bounce or breach of a level). The less time taken, the stronger the signal.
  2. If two or more trades have been opened around a certain level based on false signals, all subsequent signals from that level should be ignored.
  3. In a flat market, any pair can create numerous false signals or may not form them at all. In any case, it's best to stop trading at the first signs of a flat.
  4. Trading deals are opened during the period between the start of the European session and the middle of the American session, after which all deals should be closed manually.
  5. On the hourly timeframe, it is preferable to trade based on signals from the MACD indicator only when there is good volatility and a trend that is confirmed by a trend line or trend channel.
  6. If two levels are too close to each other (between 5 and 20 pips), they should be treated as an area of support or resistance.
  7. After a 20-pip move in the right direction, a Stop Loss should be set to breakeven.

What the Charts Show:

  • Support and resistance price levels are targets for opening buy or sell positions. Take Profit levels can be placed around them.
  • Red lines indicate trend channels or trend lines, reflecting the current trend and indicating the preferred trading direction.
  • The MACD indicator (14,22,3) — histogram and signal line — is a supplementary indicator that can also be used as a source of signals.

Important announcements and reports (always available in the news calendar) can significantly impact the movement of the currency pair. Therefore, during their release, it is recommended to trade with maximum caution or to exit the market to avoid sharp reversals against the preceding movement.

Beginners trading on the Forex market should remember that not every trade can be profitable. Developing a clear strategy and money management is key to long-term success in trading.


Opinie

ForexMart is authorized and regulated in various jurisdictions.

(Reg No.23071, IBC 2015) with a registered office at First Floor, SVG Teachers Co-operative Credit Union Limited Uptown Building, Corner of James and Middle Street, Kingstown, Saint Vincent and the Grenadines

Restricted Regions: the United States of America, North Korea, Sudan, Syria and some other regions.


© 2015-2025 Tradomart SV Ltd.
Top Top
Ostrzeżenie o ryzyku:
Kontrakty CFD są złożonymi instrumentami i wiążą się z wysokim ryzykiem szybkiej utraty pieniędzy z powodu dźwigni finansowej. 71.71% kont inwestorów detalicznych traci pieniądze podczas handlu kontraktami CFD. Zastanów się, czy rozumiesz, jak działają kontrakty CFD i czy możesz sobie pozwolić na wysokie ryzyko utraty pieniędzy.