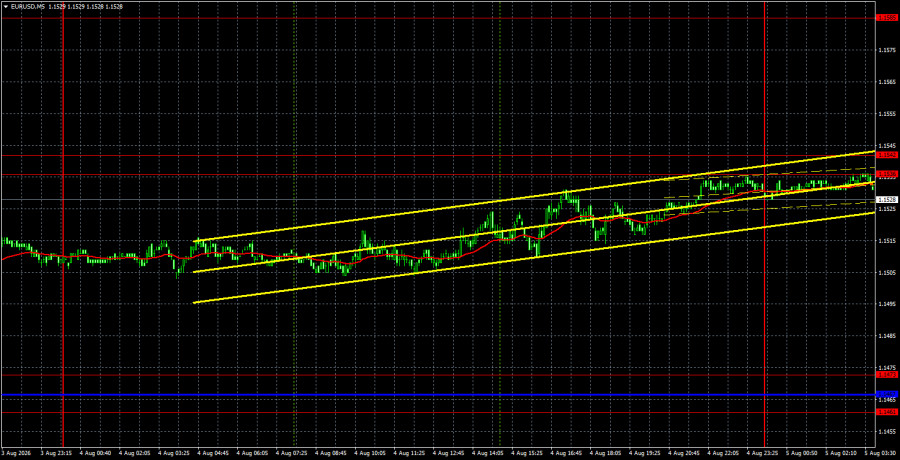
The EUR/USD currency pair on Tuesday showed only one thing—a complete unwillingness to move in either direction. By the end of the day, the European currency appreciated by about 25 pips, and the day's overall volatility did not exceed 40 pips. Thus, there was virtually no movement in the market on Tuesday. The price continues to remain above the lines of the Ichimoku indicator and generally maintains an upward trend. Therefore, at this time, we expect the continued growth of the European currency. However, there will be quite a bit of important statistical information published this week, so the U.S. dollar's growth cannot be ruled out either. As of Wednesday morning, two relatively important reports were released in the U.S.—the ISM manufacturing index and JOLTs. The ISM index came in higher than expected, allowing the dollar to gain slightly on Monday. The JOLTs report was slightly weaker than forecasts, but the market didn't even notice, as expected. Today, the second ISM index for the services sector will be released, but the market seems to have completely shifted its focus to the NonFarm Payrolls and unemployment reports, which will be released on Friday. It is these reports that will help forecast the Federal Reserve's actions in September and through the end of the year. However, we already believe the market has overestimated the American central bank's "hawkish" intentions.
From a technical perspective, the pair has exited the sideways channel of 1.1362-1.1461 after a month of torment. Traders can now expect not just an upward trend, but a full-fledged trend. Recall that over the past year, the EUR/USD pair has primarily moved sideways, and there are still no strong grounds for a long-term dollar trend.
On the 5-minute timeframe on Tuesday, no trading signals were formed. Only towards the end of the day did the pair return to the 1.1536-1.1542 area, so a trading signal may form around it today.
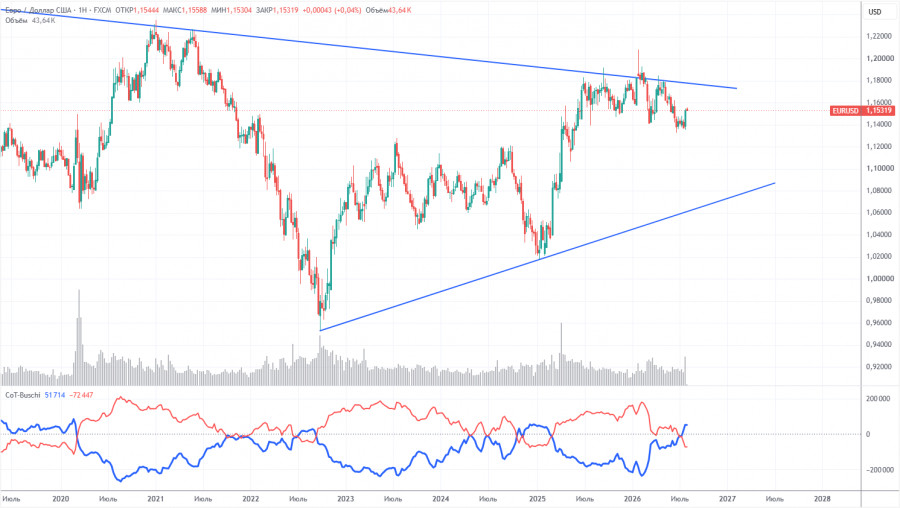
The latest COT report is dated July 28. In the weekly timeframe, it is evident that the net position of non-commercial traders has turned "bearish" and has significantly decreased in 2026 due to geopolitical events. Traders have been shedding the European currency in favor of the U.S. dollar in recent months. Donald Trump's policy has not changed, but for a time, the dollar acted as a "reserve currency."
We still do not see any fundamental factors for strengthening the European currency, but there are plenty of factors for the U.S. dollar to decline. The war in the Middle East temporarily made the dollar super-attractive, but when this factor reaches its "expiration date," everything will return to its previous state. In the long term, the euro could fall to as low as $1.08 (the trend line), but the upward trend will remain relevant. Over the past months of dollar growth, the pair has not approached this line significantly.
The arrangement of the red and blue lines of the indicator indicates parity between bulls and bears. During the last reporting week, the number of longs in the "Non-commercial" group decreased by 15,500, while the number of shorts increased by 15,600. Consequently, the net position of non-commercial traders decreased by 31,100 contracts over the week.
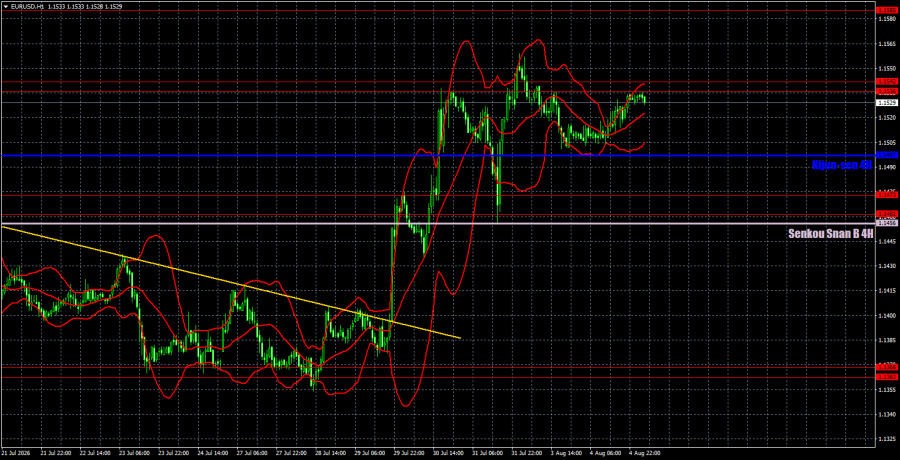
On the hourly timeframe, the pair has resumed an upward trend after a month-long pause. The situation in the Middle East remains tense and has not improved, but this is no longer sufficient to support a new, powerful rise in the dollar. The market has ignored all favorable factors for the euro in recent months and has focused solely on the Fed's monetary policy, to which it has had inflated expectations. If the situation has now changed, the European currency has the opportunity to reflect on all past news/events/reports that the market has ignored.
For August 5, we identify the following levels for trading: 1.1234, 1.1274, 1.1362-1.1368, 1.1461-1.1473, 1.1536-1.1542, 1.1585, 1.1657-1.1666, 1.1750-1.1760, 1.1786, 1.1830-1.1837, as well as the Senkou Span B line (1.1456) and Kijun-sen line (1.1497). The lines of the Ichimoku indicator may move during the day, which should be taken into account when determining trading signals. Don't forget to set a Stop Loss at breakeven if the price moves in the correct direction by 15 pips. This will safeguard against potential losses if the signal proves false.
On Wednesday, Germany, the Eurozone, and the U.S. will release second estimates of the business activity indices for July, and the EU will also publish the producer price index. However, all these reports are secondary. The market may only pay attention to the ADP and ISM reports in the U.S.
Today, traders may open new short positions with targets at 1.1497 and 1.1461-1.1473 if the price bounces off the 1.1536-1.1542 area. A consolidation above the area of 1.1536-1.1542 will allow for opening new long positions with targets of 1.1585 and 1.1657-1.1666.

SZYBKIE LINKI




















 Skontaktuj się z ForexMart