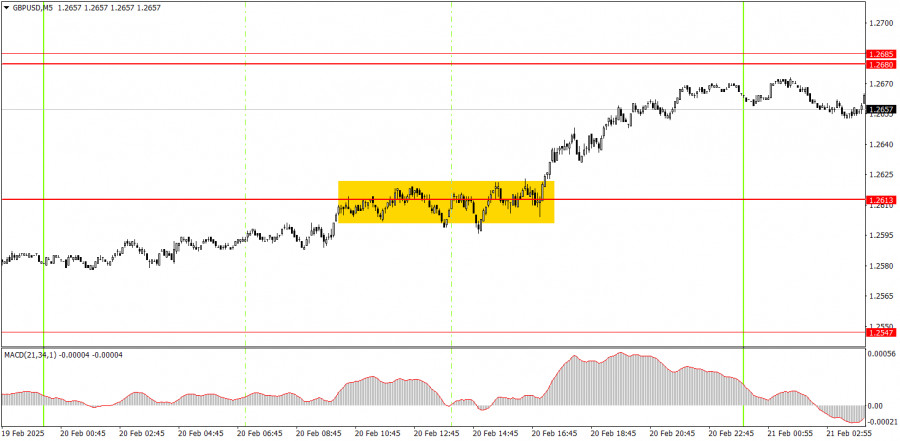

The GBP/USD pair traded higher on Thursday, even though there weren't any fundamental or macroeconomic reasons for this increase. Earlier in the week, the market seemed to "ignore" reports concerning wages, unemployment, and inflation in the UK. However, on Thursday, it either reacted to these reports retroactively or simply bought the pound without any clear rationale. Currently, the movements in this pair appear illogical, but the primary factor driving the pound upward remains consistent: a need for correction on the daily timeframe.
Today, there are at least three important reports being released in the UK, as well as three significant reports from the US. Due to this, market movements throughout the day could become chaotic, which is common during a correction period. In our view, the British currency has already appreciated too much against the dollar at this stage. Therefore, we anticipate a decline today, unless the UK business activity indices deliver unexpectedly strong results.

Only one trading signal was formed on Thursday on the 5-minute chart, and even that was difficult to classify as a valid signal. During the European trading session, the price rose to the 1.2613 level, and then, the next 6 or 7 hours were spent struggling to decide its next direction. Eventually, the balance tipped in favor of continued growth, and by the end of the day, the pound had gained another 40 pips. However, once again, the signal was far from obvious and not the best one.
On the hourly timeframe, the GBP/USD pair may be beginning a short-term downtrend; however, the recent movements over the past few weeks are part of a larger correction on the daily timeframe. In the medium term, we still anticipate a decline in the pound toward 1.1800, which seems to be the most logical scenario. Therefore, it's crucial to wait for the conclusion of the upward correction on the daily timeframe.
On Friday, the GBP/USD pair might initiate a new downward movement. The price has risen for six consecutive days without substantial justification, followed by three days of consolidation, and has recently shown another unsubstantiated rise. Nonetheless, the short-term uptrend remains intact, and the market is currently trading without clear reference to reports and events.
On the 5-minute timeframe, trading should focus on the following levels: 1.2164–1.2170, 1.2241–1.2270, 1.2301, 1.2372–1.2387, 1.2445, 1.2502–1.2508, 1.2547, 1.2613, 1.2680–1.2685, 1.2723, and 1.2791–1.2798. On Friday, the UK is set to release business activity indices and retail sales data. In the US, business activity indices and the University of Michigan consumer sentiment index will also be published. All six of these reports could potentially trigger a market reaction, even if only slightly.
Support and Resistance Levels: These are target levels for opening or closing positions and can also serve as points for placing Take Profit orders.
Red Lines: Channels or trendlines indicating the current trend and the preferred direction for trading.
MACD Indicator (14,22,3): A histogram and signal line used as a supplementary source of trading signals.
Important Events and Reports: Found in the economic calendar, these can heavily influence price movements. Exercise caution or exit the market during their release to avoid sharp reversals.
Forex trading beginners should remember that not every trade will be profitable. Developing a clear strategy and practicing proper money management are essential for long-term trading success.

LINKS RÁPIDOS