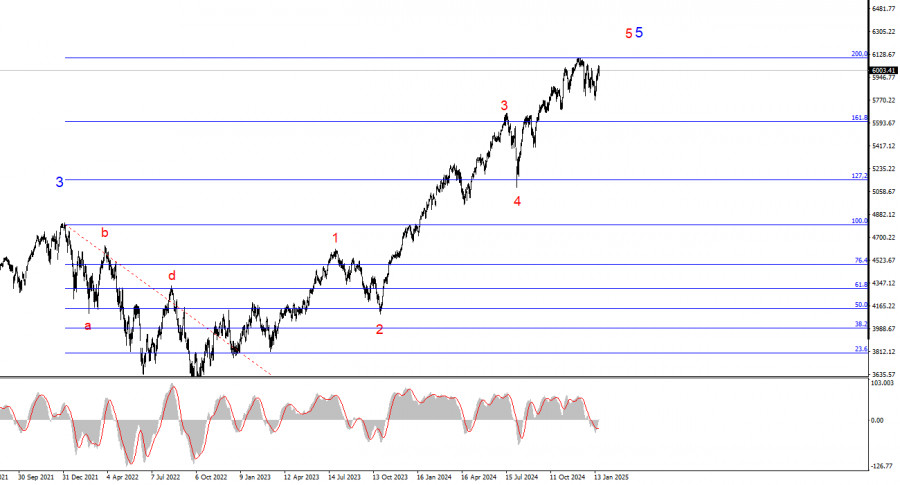
The 4-hour wave structure for #SPX is not straightforward and should be analyzed alongside the wave structure on the 24-hour chart. The first noticeable feature is the global five-wave structure, which is so extensive that it cannot fit into the chart window on the smallest scale. In simpler terms, U.S. stock indices have been rising for a long time, and we know trends change. Currently, wave 5 of 5 is being constructed. The index failed to break through the 6093 mark (equivalent to 200.0% Fibonacci), but this did not result in any significant pullback.
On the 4-hour chart, four waves within 5 of 5 are visible, but the fifth wave has taken on a peculiar three-wave form, followed by a complex downward structure, making it challenging to identify distinct waves. It's worth noting that wave structures should be unambiguous. The more complicated the structure, the harder it is to profit from it. If the recent decline is a "bullish flag," the S&P 500 index will likely continue its upward trend. However, it could also be a sideways channel, which does not qualify as a "bullish flag."
The S&P 500 slightly declined on Monday following Donald Trump's inauguration. However, it's worth noting that the rally halted as soon as Trump won the election. This indicates that investors are wary of the "innovations" introduced by the new White House administration. This hesitation is understandable. As mentioned, Trump will likely make (or attempt to make, considering Congress must approve his initiatives) decisions that may not necessarily improve the economic situation. He will focus on geopolitical issues, trade imbalances, gender policies, illegal immigration, and deportation. Some of these decisions could negatively impact the economy. For investors in various companies—and the companies themselves—what matters most is the state of the economy, its growth rates, and prospects. If these deteriorate under Trump (as many economists predict), the rally in key stock indices will unlikely continue.
Given this context, I do not expect the S&P 500 to rise above 6043 soon. A decline toward 5800 seems more probable. However, much will depend on the decisions Trump begins to implement. While the words of the U.S. president undoubtedly influence market sentiment, actions carry far greater weight.

From the analysis of #SPX, I conclude that the instrument continues to build an upward trend. There are no convincing signs that this trend is over. The wave structure of recent months remains highly complex and ambiguous. I recommend focusing on the "bullish flag" and Trump's policies in the current situation. The less favorable Trump's policies are for American companies (e.g., trade wars, tariffs, import duties, retaliatory tariffs against the U.S.), the more likely we will see a new downward trend.
On a larger scale, the wave pattern is much clearer. A distinct five-wave structure exists, with a five-wave formation within the fifth wave. This fifth wave may be nearing its completion. Thus, I prepare for a long and complex correction, which may have already begun.

RÁPIDOS ENLACES