Agentura S&P Global Ratings upravila výhled ratingu pro americkou společnost Lamb Weston Holdings Inc (NYSE:LW) na negativní ze stabilního s odkazem na náročné provozní prostředí a konkurenční tlaky. Ratingová agentura potvrdila rating emitenta společnosti na úrovni „BB+“ a rating na úrovni „BB+“ pro nadřízené nezajištěné dluhopisy společnosti. Revize výhledu odráží očekávání, že provozní výkonnost a úvěrové ukazatele společnosti Lamb budou nadále pod tlakem sílící konkurence, klesajícího využití kapacit a potenciálních rizik obchodní politiky.
Konkurenční pozice společnosti Lamb Weston byla ovlivněna zmírněním provozu restaurací a zvýšeným ohlášeným navýšením kapacit v celém odvětví. Zisky společnosti oslabily, což vedlo k tomu, že zadluženost upravená agenturou S&P Global Ratings dosáhla za dvanáct měsíců končících 28. února 2025 hodnoty 3,8x, což je více než 3,5x, což je spouštěcí hodnota pro snížení ratingu. Agentura S&P nicméně očekává mírné oživení ukazatele EBITDA ve fiskálním roce 2026 s tendencí k pákovému efektu v oblasti nízké trojnásobné hodnoty, a to díky programům úspor nákladů společnosti.
The EUR/USD currency pair paused on Thursday, just as we anticipated. There were no major reports or events scheduled for the day, and for once, Donald Trump took a break and didn't impose new tariffs. As a result, the market spent the day recovering and resting after Wednesday, when Jerome Powell made it clear that the Federal Reserve might limit itself to just one rate cut by year-end. As we mentioned before, the market once again shot itself in the foot by unjustifiably expecting ultra-dovish decisions from the Fed, only to be disappointed when Powell continued to follow the "inflation-focused" line in setting monetary policy. The dollar has strengthened this week, entirely deservedly and logically, as nearly all key events and reports have favored it.
From a technical standpoint, a downtrend is still forming on the hourly time frame, but the movement is almost uninterrupted. Therefore, there are no two extremes to draw a trend line or channel. Thus, the trend exists, but there are no clear markers for its potential end.
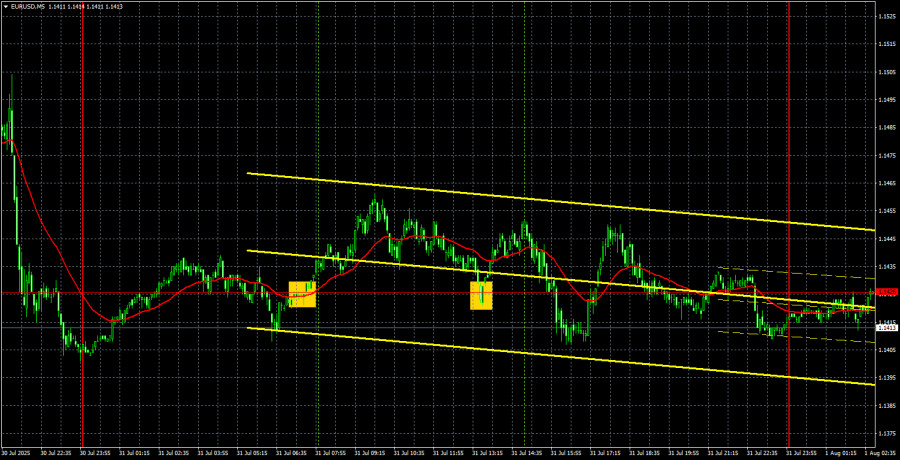
On the 5-minute chart, Thursday was characterized by a flat market, leading to numerous false trading signals. The first two buy signals around the 1.1426 level could have been acted upon, but brought no profit. In both cases, the price moved at least 15 pips in the desired direction, so these trades could not have resulted in losses. However, all subsequent signals near the 1.1426 level should have been ignored since the first two turned out to be false.
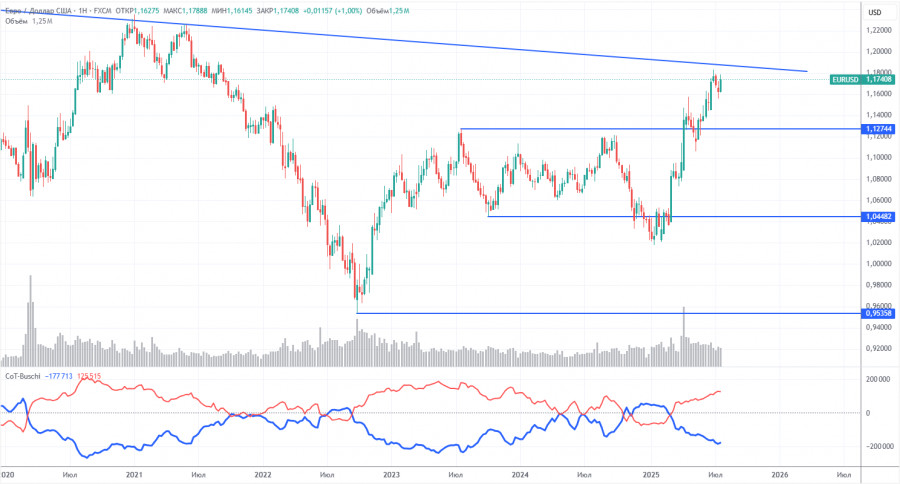
The latest COT (Commitment of Traders) report is dated July 22. As shown in the chart above, the net position of non-commercial traders was bullish for a long time. Bears barely took control at the end of 2024, but quickly lost it. Since Trump took office as President of the U.S., the dollar has only declined. While we can't say with 100% certainty that this decline will continue, current global developments suggest this scenario is likely.
We still see no fundamental factors supporting the euro, but one strong factor remains weighing on the U.S. dollar. The global downtrend remains intact, but what does it matter where the price has moved over the last 16 years? Once Trump ends his trade wars, the dollar may begin to rise — but when will that happen?
The position of the red and blue lines in the indicator continues to show a bullish trend. During the last reporting week, long positions held by the "Non-commercial" group increased by 6,200, while shorts increased by 8,900. Therefore, the net position decreased by 1,700 contracts — a negligible change.
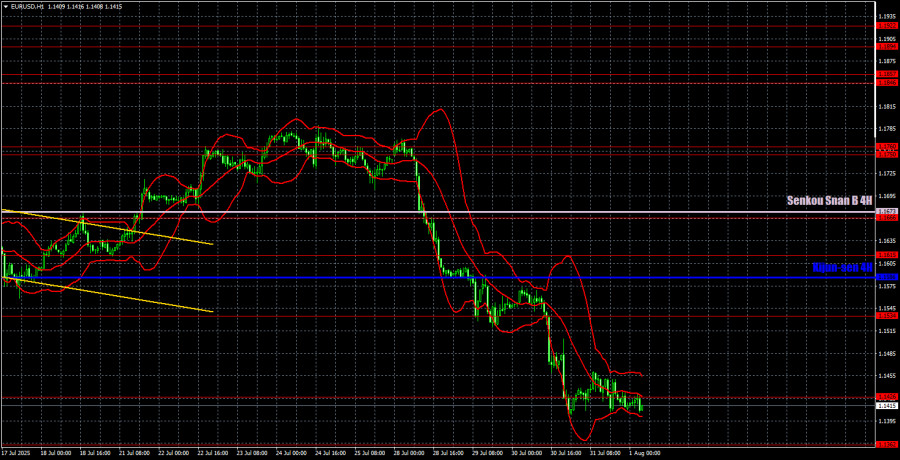
In the hourly time frame, the EUR/USD pair began and continues to fall sharply, which is entirely justified this week. The trade deal between Trump and the EU is a severe blow to the euro, but other macroeconomic data have also supported the dollar. Backed by local macroeconomic conditions, the dollar can expect further growth, although we still do not anticipate a medium-term rally. Currently, a correction is ongoing on the daily time frame.
For August 1, we highlight the following trading levels: 1.1092, 1.1147, 1.1185, 1.1234, 1.1274, 1.1362, 1.1426, 1.1534, 1.1615, 1.1666, 1.1750-1.1760, 1.1846-1.1857. Also, the Ichimoku lines: Senkou Span B at 1.1673 and Kijun-sen at 1.1586. These may shift during the day, so keep this in mind when interpreting trading signals. Don't forget to set Stop Loss to breakeven once the price moves 15 pips in the correct direction. This protects against potential losses from false signals.
On Friday, the EU is set to release the relatively important Consumer Price Index, while the U.S. will publish NonFarm Payrolls, the unemployment rate, and the ISM Manufacturing PMI. These U.S. reports could trigger strong moves in the second half of the day.
On Friday, the pair's movement will once again largely depend on the macroeconomic backdrop. The U.S. dollar has performed well this week, but today everything hinges on three key reports. Therefore, the pair has an equal chance of rising or falling.

RÁPIDOS ENLACES


 Contáctenos