The EUR/USD currency pair continued to trade... sideways throughout Wednesday. In recent days, we didn't expect the market to settle into a flat range, but at this point, we can confidently say the pair is in either a sideways channel or a movement that strongly resembles one. There remains an upward tilt, yet macroeconomic data and fundamentals have almost no lasting influence on price movement. To be more specific, individual economic reports do trigger market reactions, but these reports often contradict one another—preventing any sustained trend formation.
Wednesday was a textbook example. Eurozone inflation data came in exactly as forecast and understandably led to a decline in the euro. Then, during the U.S. session, the ADP employment report for the U.S. was released with weak numbers, which led to a weakening of the dollar. But a couple of hours later, the U.S. ISM Manufacturing PMI came out slightly better than expected (by just 0.1 points), yet it triggered notable dollar strength. Three reports — all pointing in different directions.
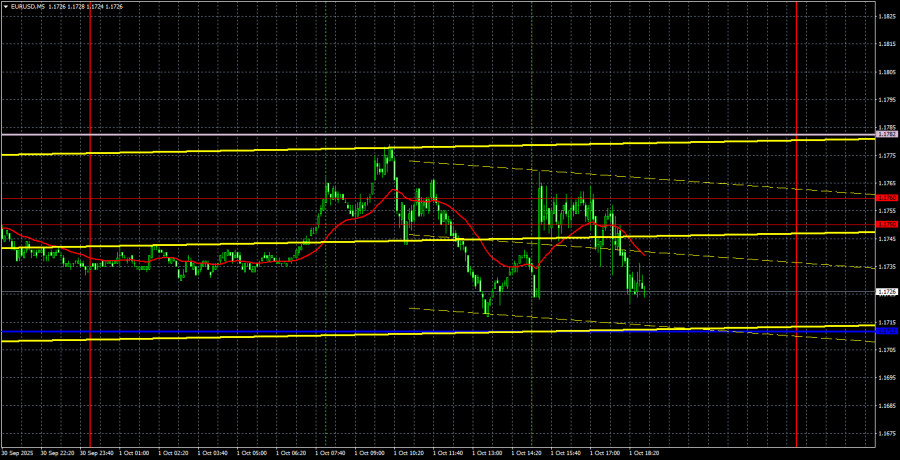
On the 5-minute chart, several trade signals were generated; however, reviewing them has little value since each time a signal formed and the price began to move, another report was released that reversed the move. It seems this flat market is less a sign of consolidation and more a product of conflicting short-term catalysts. Nonetheless, sideways movement remains the dominant theme.
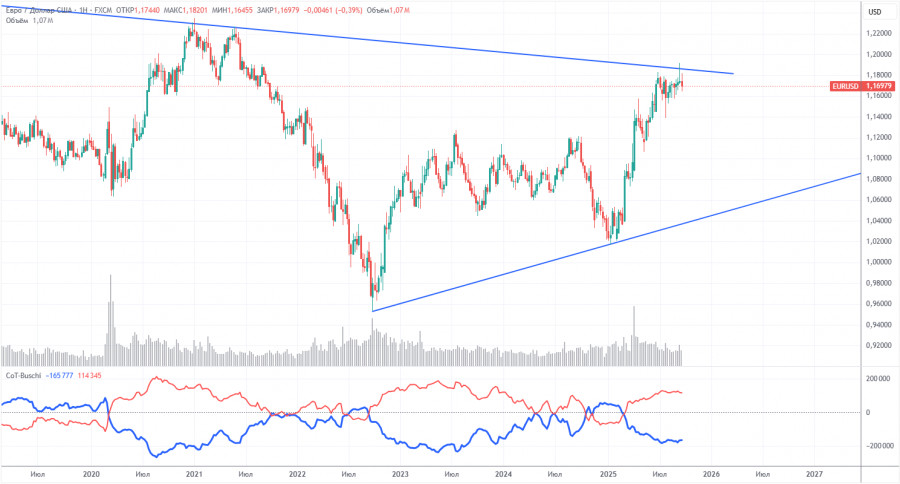
The latest COT report is dated September 23. As the chart above clearly shows, the net position of non-commercial traders has long been "bullish." Bears barely managed to gain control at the end of 2024 but quickly lost it. Since Trump took office for his second term as president, the dollar has been falling. We cannot say with 100% certainty that this decline will continue, but current global developments suggest otherwise.
We still see no fundamental reasons for the euro to weaken, while there remain plenty of reasons for the dollar to fall. The global downtrend remains in place, but what does it matter now where the price moved over the past 17 years? Once Trump ends his trade wars, the dollar may recover, but recent events suggest that the war will continue in one form or another. The potential loss of Federal Reserve independence is another powerful factor weighing on the U.S. currency.
The positions of the red and blue lines of the indicator continue to indicate a bullish trend. Over the last reporting week, the number of longs among the "Non-commercial" group decreased by 800, while the number of shorts increased by 2,600. Accordingly, the net position decreased by 3,400 contracts for the week.
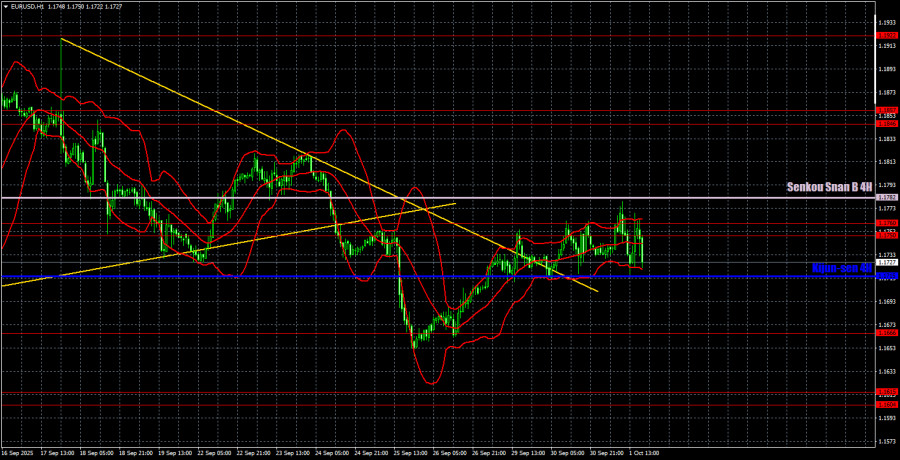
On the 1-hour timeframe, EUR/USD continues to form a downward trend. However, this trend cannot yet be considered finished, as price movement remains mostly sideways and has not broken above the 1.1750–1.1760 area or the Senkou Span B line. That said, we still see no compelling reason to expect a sustained dollar rally. The daily chart clearly shows that the broader uptrend remains intact.
For October 2, the following trading levels are highlighted: 1.1234, 1.1274, 1.1362, 1.1426, 1.1534, 1.1604–1.1615, 1.1666, 1.1750–1.1760, 1.1846–1.1857, 1.1922, 1.1971–1.1988, as well as key Ichimoku lines: Senkou Span B (1.1782) and Kijun-sen (1.1715). Please note that these Ichimoku indicator lines can shift throughout the day, so they should be monitored when identifying trade signals. Don't forget to place your Stop Loss at breakeven when the price moves 15 pips in your favor — this protects you from losses if a signal turns out to be false.
On Thursday, the Eurozone will release its unemployment report, and the U.S. will publish jobless claims. Both are considered secondary reports. After three days of near-flat movement, such conditions are likely to continue today.
On Thursday, the euro could continue its recovery. For traders to confirm the end of the bearish trend, the price needs to break above the 1.1750–1.1760 area and the Senkou Span B line. A rebound from this area will support short positions; however, it is worth noting that the dollar currently receives little support from news catalysts.

HIZLI BAĞLANTILAR
show error
Unable to load the requested language file: language/turkish/cookies_lang.php
date: 2025-10-02 10:25:27 IP: 216.73.216.99


 Bize Ulaşın

