The EUR/USD currency pair continued its upward movement on Friday. The first thought that comes to mind is that the dollar has run out of steam. Over the past month and a half, the U.S. currency did not have strong reasons to keep rising continuously. We cannot say the dollar has excessively increased, and the daily timeframe shows this is not the case. However, it did rise at a time when its decline would have raised no questions. The market has ignored everything over the past month and a half: the dovish stance of the Federal Reserve, the U.S. shutdown (which began on October 1 and is still ongoing), Donald Trump's new tariffs and duties, and the lack of key labor market and unemployment statistics. Now, the market may start to address all these factors belatedly. The upward trend for 2025 remains relevant, and the price on the daily timeframe has dropped to the area near the lower boundary of the range at 1.1400-1.1830. Thus, the movements we have seen recently are mostly technical. There is no trend line on the hourly timeframe, so clear confirmations of the end of the downward trend are currently absent.
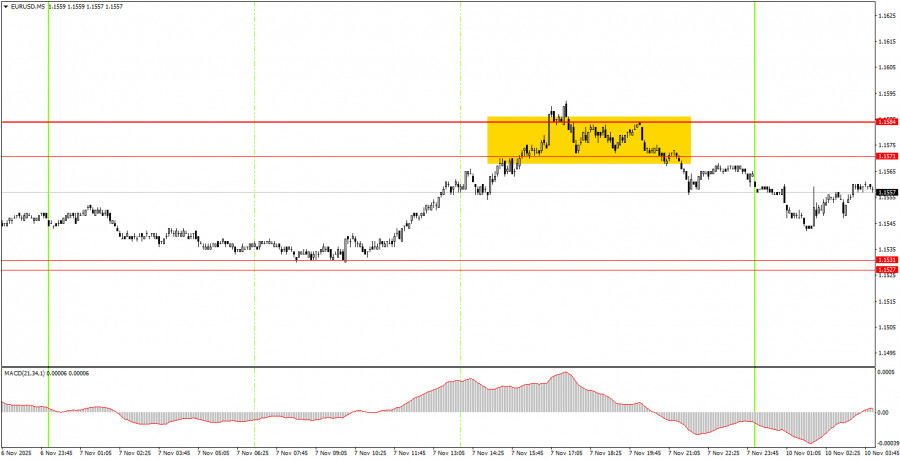
On the 5-minute timeframe, a trading signal was formed on Friday, but it came towards the end of the working week in the currency market. The price bounced off the 1.1571-1.1584 area, allowing short positions to be opened. However, in our view, it was not worth doing this right before the market closed for the weekend. If any beginners acted on this signal, they would be in profit now and could move their Stop Loss to breakeven.
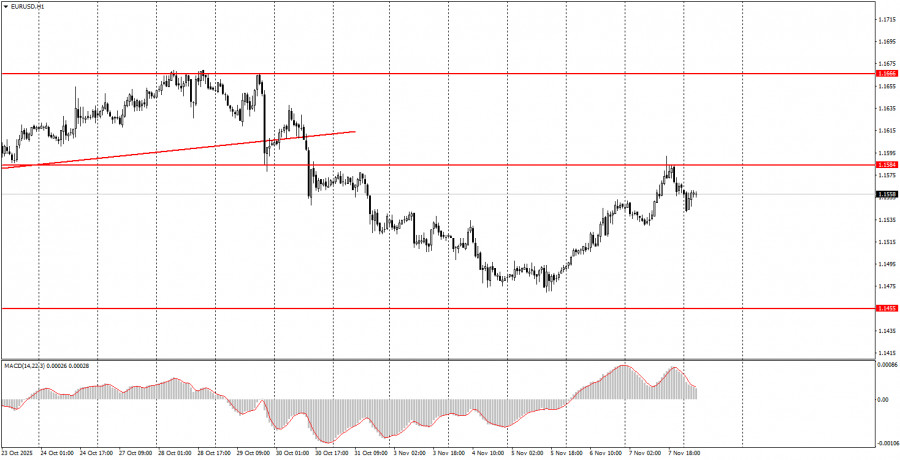
On the hourly timeframe, the EUR/USD pair still maintains its downward trend, but it may end soon. The overall fundamental and macroeconomic background for the U.S. dollar remains very weak. Thus, only on technical grounds can the euro continue to decline – the flat on the daily timeframe is still relevant. However, we expect its completion and a resumption of the upward trend for 2025.
On Monday, novice traders can trade from the areas of 1.1527-1.1531 and 1.1571-1.1584. Today, there will be no macroeconomic background, so volatility may be very weak.
On the 5-minute timeframe, traders should consider the levels of 1.1354-1.1363, 1.1413, 1.1455-1.1474, 1.1527-1.1531, 1.1571-1.1584, 1.1655-1.1666, 1.1745-1.1754, 1.1808, 1.1851, 1.1908, and 1.1970-1.1988. There are no interesting events or reports scheduled in the U.S. and the Eurozone for Monday. Therefore, it is unlikely we will see strong, attractive movements during the day.
Important announcements and reports (always available in the news calendar) can significantly impact the movement of the currency pair. Therefore, during their release, it is recommended to trade with maximum caution or to exit the market to avoid sharp reversals against the preceding movement.
Beginners trading on the Forex market should remember that not every trade can be profitable. Developing a clear strategy and money management is key to long-term success in trading.

HIZLI BAĞLANTILAR
show error
Unable to load the requested language file: language/turkish/cookies_lang.php
date: 2025-11-10 05:03:39 IP: 216.73.216.96


 Bize Ulaşın

