The EUR/USD currency pair resumed its downward corrective movement on Tuesday. Volatility has remained relatively weak for several days, and the pair's decline is primarily observed due to technical reasons. Only yesterday's US retail sales report could provide slight support for the US dollar; however, as mentioned over the weekend, this week may be corrective. The geopolitical factor currently has no impact on market sentiment, and there is little news aside from the ongoing cancellations and rescheduling of negotiations between the US and Iran. A new round of negotiations may take place today, but we wouldn't be surprised if it's canceled or postponed again. Neither Washington nor Tehran can currently even agree on the conditions for new negotiations.
From a technical perspective, the upward trend is still intact, as evidenced by the trend line. This week, geopolitics could influence the pair's movement, at which point technical factors may take a back seat. If the negotiations conclude successfully or, conversely, fail and the war resumes, it could have a significant impact on traders and trigger strong market reactions. However, it's still too early to speak about that; for now, a technical correction is the most we can do.
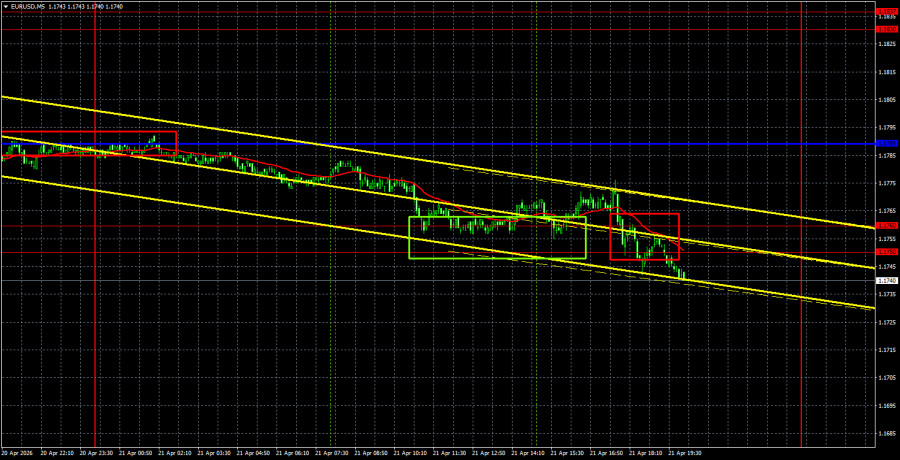
Yesterday, three trading signals were formed. Early in the night, the price bounced off a critical line, and at the opening of the European trading session, the price was not far from the breakout point. Therefore, traders could have opened short positions. The nearest target area, 1.1750-1.1760, was reached, but the buy signal that formed around it proved false. The next sell signal allowed traders to close the second of three trades in profit.
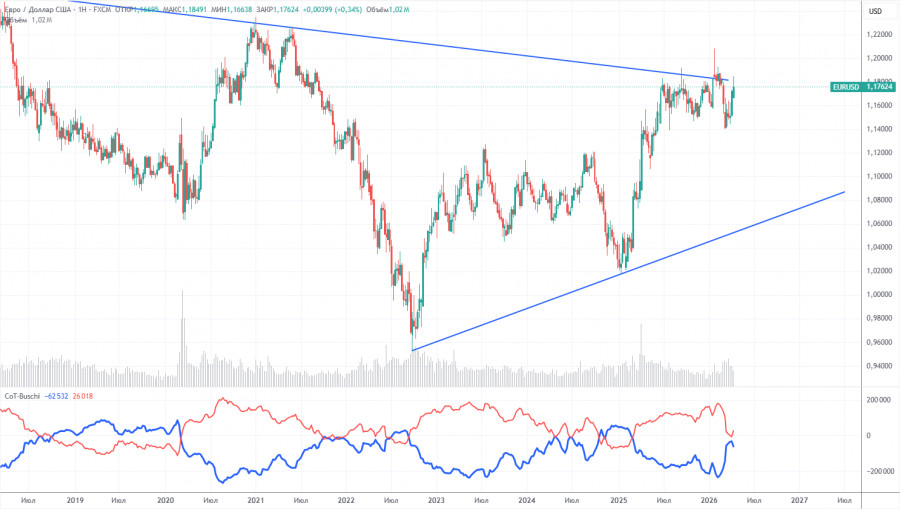
The latest COT report is dated April 14. The illustration on the weekly timeframe clearly shows that the net position of non-commercial traders remains "bullish," but is rapidly declining amid geopolitical events. Traders are offloading the euro in favor of the US dollar. Donald Trump's policy has not changed, but the dollar now acts as a "reserve currency," which ensures its high demand.
We still do not see any fundamental factors supporting the strengthening of the euro, yet several factors remain that could lead to a decline in the dollar. The war in the Middle East made the dollar temporarily very attractive, but once this factor reaches its "expiration date," everything will return to normal. In the long term, the euro could decline to as low as 1.06$ (the trend line), but the upward trend will still remain relevant. Currently, the pair has not moved significantly away from the descending trend line, which has been broken several times.
The positioning of the red and blue lines of the indicator indicates parity between bulls and bears. During the last reporting week, the number of longs in the "Non-commercial" group increased by 13,700, while the number of shorts decreased by 19,900. Consequently, the net position rose by 33,600 contracts over the week.
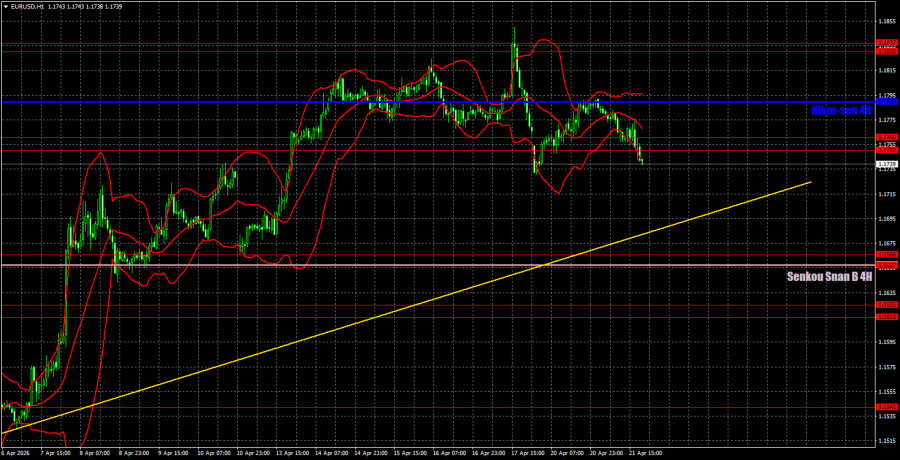
On the hourly timeframe, the EUR/USD pair continues to form an upward trend but is currently correcting this week. A new escalation in the Middle East may again shift traders' priorities, so we cannot entirely rule out a decline in the pair. The situation in the Middle East remains tense but is not worsening, which means there are currently few solid reasons for the US dollar to strengthen further. There are no technical grounds to expect the pair to drop below 1.1400.
For April 22, we highlight the following levels for trading: 1.1362, 1.1426, 1.1542, 1.1615-1.1625, 1.1657-1.1666, 1.1750-1.1760, 1.1830-1.1837, 1.1907-1.1922, as well as the Senkou Span B line (1.1658) and the Kijun-sen line (1.1789). The lines of the Ichimoku indicator may shift during the day, which should be considered when determining trading signals. Don't forget to set a Stop Loss order to break even once the price has moved in the right direction by 15 pips. This will protect against possible losses if the signal turns out to be false.
On Wednesday, ECB President Christine Lagarde will give another speech, following her comments on the latest events in the Middle East on Monday and her insights on the economy and monetary policy prospects. Also, new negotiations between Tehran and Washington are supposed to take place today, although this is still just a supposition.
On Wednesday, traders may remain in short positions after the price settles below the 1.1750-1.1760 area, targeting 1.1657-1.1666. Long positions can be opened if the price settles above the area of 1.1750-1.1760, targeting 1.1830-1.1837.
Price levels of support and resistance – thick red lines, around which the movement may end. They are not sources of trading signals.
Kijun-sen and Senkou Span B lines – lines of the Ichimoku indicator that are carried over to the hourly timeframe from the 4-hour one. They are strong lines.
Extreme levels – thin red lines from which the price has previously bounced. They are sources of trading signals.
Yellow lines – trend lines, trend channels, and any other technical patterns.
Indicator 1 on COT charts – the size of the net position of each category of traders.

HIZLI BAĞLANTILAR
show error
Unable to load the requested language file: language/turkish/cookies_lang.php
date: 2026-04-22 06:16:40 IP: 172.18.0.1


 Bize Ulaşın

