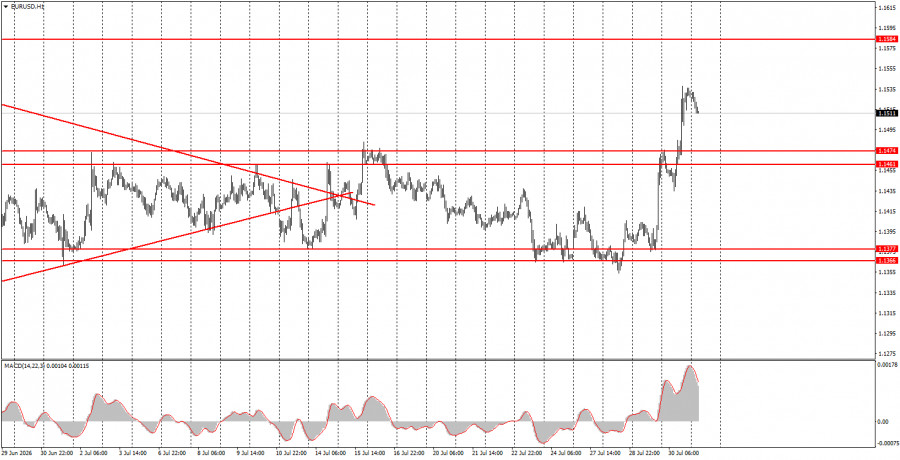
The EUR/USD currency pair continued its upward movement during Thursday's trading, driven by objective and compelling factors. Firstly, the Federal Reserve disappointed the currency market with a stance that was not sufficiently hawkish. While the Fed seems ready to raise rates in 2026, doubts about this have been growing each week. Secondly, key GDP reports from Germany, the Eurozone, and the US unequivocally supported the European currency. If one of these reports had favored the dollar while two had favored the euro, we might not have seen a strong increase in the European currency. However, all three indicators were in favor of the euro. Thirdly, inflation in Germany exceeded forecasts in July, and a similar trend may be seen in today's Eurozone inflation data. Thus, the European Central Bank could conduct a second tightening of monetary policy in September, unlike the Fed, which continues to observe, wait, and hope for inflation to decrease on its own.
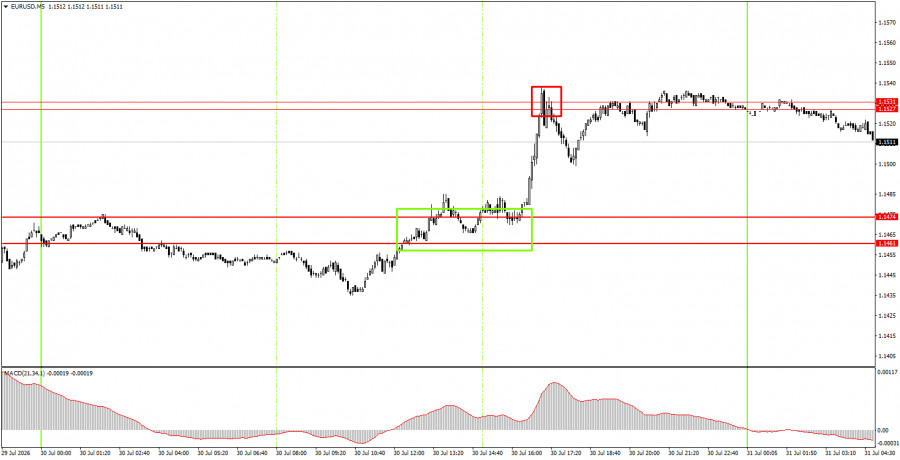
On the 5-minute time frame, the pair formed two good trading signals that novice traders could capitalize on. During the American trading session, the price broke through the 1.1461-1.1474 area, allowing for long positions. Within an hour, the price reached the 1.1527-1.1531 area, where traders could secure profits. A bounce from this area allowed short positions, but the price failed to show a strong decline, so the trade closed at breakeven.
On the hourly time frame, the price has left the sideways channel it spent a month in. Considering all the global events in recent months, we believe that the European currency should begin a confident rise. Recently, the market has been diligently ignoring almost all factors favoring the euro, so now a "consolidation" might begin, bringing the pair's exchange rate to its fair value.
On Friday, novice traders can open new short positions targeting 1.1461-1.1474, as the price has bounced off the 1.1527-1.1531 area. New long positions can be opened if the price breaks through the 1.1527-1.1531 area, targeting 1.1584-1.1594.
On the 5-minute time frame, levels to watch include 1.1267-1.1275, 1.1366-1.1377, 1.1461-1.1474, 1.1527-1.1531, 1.1584-1.1594, 1.1655-1.1666, and 1.1745-1.1754. On Friday, a report on inflation for the Eurozone is scheduled to be published, and it could also exceed forecasts. In that case, the European currency may continue to rise, as the ECB moves even closer to a second monetary policy tightening.
Price levels (areas) of support and resistance are targets when opening long or short positions or sources of signals.
Red lines indicate channels or trend lines that display the current trend and indicate the preferred direction for trading.
The MACD indicator (14,22,3) – histogram and signal line – is a supplementary indicator that can also be used as a source of signals.
Important speeches and reports (contained in the news calendar) can significantly impact the movement of the currency pair. Therefore, during their release, trading should be conducted with maximum caution, or one should exit the market to avoid sharp reversals against preceding movements.
Beginners trading in the forex market should remember that not every trade can be profitable. Developing a clear strategy and practicing money management are key to long-term success in trading.
HIZLI BAĞLANTILAR
show error
Unable to load the requested language file: language/turkish/cookies_lang.php
date: 2026-07-31 01:17:34 IP: 172.18.0.1

















 Bize Ulaşın