Akcionáři britské fintechové společnosti Wise (LON:WISEa) Plc v pondělí schválili plán přesunu primárního kotování společnosti na burzu ve Spojených státech.
Rozhodnutí bylo přijato na mimořádné valné hromadě, na které akcionáři hlasovali pro navrhovanou změnu místa primárního kotování.
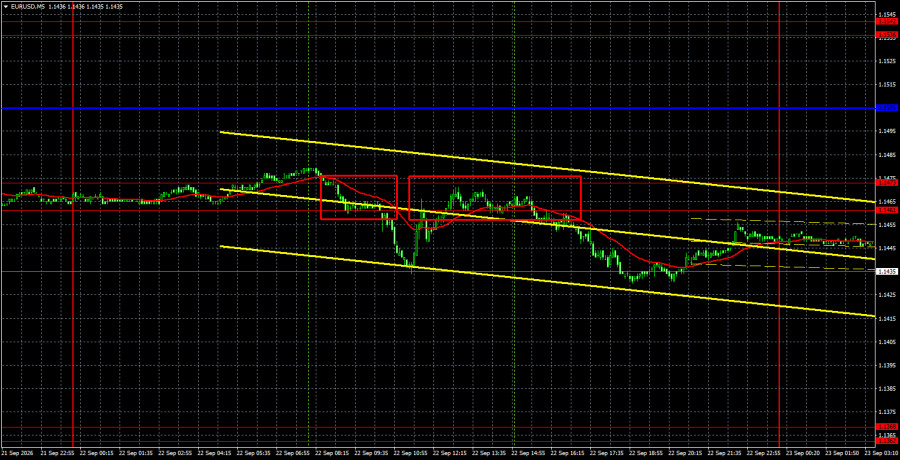
The EUR/USD pair on Tuesday resumed its downward movement within the existing downtrend after failing to begin an upside correction for three days. The 1.1461–1.1473 area was breached, allowing the US currency to continue higher toward the next support zone at 1.1362–1.1368. The trend line remains relevant, and from a technical perspective, the move is logical and coherent. The only way to call the move illogical is from a fundamental or macroeconomic viewpoint. It is worth noting that after a fairly large drop in recent weeks, the pair could not even mount a modest correction. Also note that no major economic events or releases occurred in the US or the euro area during the first two days of the week. The basis for the market's resumption of dollar buying is unclear. This question has persisted over the past 2–3 weeks as the market first priced in future Federal Reserve tightening, then the Fed's rate hike, and then future Fed tightening again. In essence, the market is now ignoring almost all other factors. In such circumstances, the dollar could hypothetically keep gaining indefinitely — a joke, of course, but with a grain of truth.
Technically, a downtrend continues to form. The market again ignored the European Central Bank's hawkish move but emphatically priced the Fed's hike. The flat is over, the pair broke an important support zone, the trend line remains intact, and price trades below Ichimoku lines. Technically, the current drop is fully justified.
On the 5-minute timeframe on Tuesday, two sell signals formed. Price bounced twice from the 1.1461–1.1473 area and fell roughly 20 pips on each occasion. Further euro weakness may continue today.
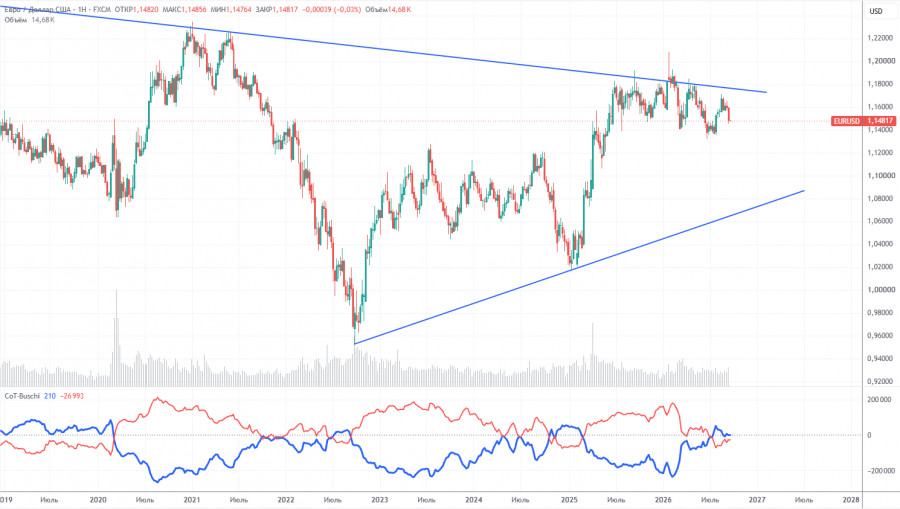
The latest COT report is dated September 15. On the weekly timeframe, it is clear that non-commercial traders' net position remains bearish and has fallen sharply in 2026 amid geopolitical events. Traders have been reducing euro exposure in favor of the US dollar over the past six months. Trump's policy has not changed, but the dollar acted as a reserve currency for a period.
However, we still do not see fundamental factors for further USD strength. The Middle East war made the dollar temporarily super-attractive, but when that factor's "shelf life" expires, everything should return to normal — and that shelf life may already have expired. In the long term, the euro could fall as low as $1.08 (trend line), but the long-term uptrend remains intact. During recent months of dollar strength, the pair has not come close to that trend line.
The placement of the red and blue indicator lines indicates approximate parity between bulls and bears. During the last reporting week, long positions in the "Non-commercial" group rose by 10,500 contracts while shorts fell by 5,100. Accordingly, the net position increased by 15,600 contracts for the week.
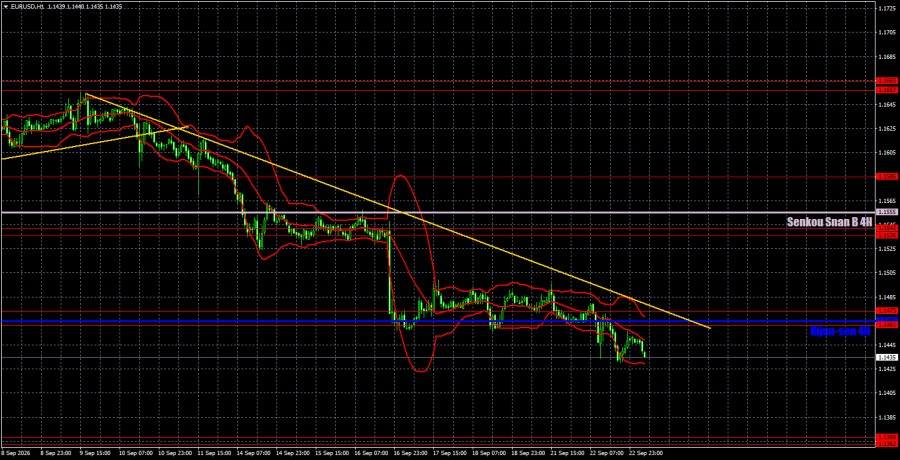
On the hourly timeframe, EUR/USD continues to form a downward trend, and the Fed has strongly supported the downward move. The ECB should have supported the euro last week when it raised rates for the second time in 2026, but the market now focuses primarily on the Fed and its tightening. As a result, the dollar has effectively formed a full-blown trend out of thin air, and market sentiment may remain bearish going forward.
For September 23 we highlight the following trading levels — 1.1234, 1.1274, 1.1362–1.1368, 1.1461–1.1473, 1.1536–1.1542, 1.1585, 1.1657–1.1665, 1.1750–1.1760, 1.1786, 1.1830–1.1837, as well as the Senkou Span B line (1.1555) and the Kijun-sen (1.1465). The Ichimoku indicator lines may shift during the day, which should be taken into account when determining trading signals. Remember to move the Stop Loss to breakeven if the price moves 15 pips in the right direction. This will protect against possible losses if the signal proves false.
On Wednesday, the euro area and the US will publish first-estimate business-activity indices for September. These releases are not super-important but can still influence market sentiment.
Today traders may remain in short positions targeting 1.1362–1.1368, as price has closed below the 1.1461–1.1473 area. Consider long positions only if price closes and holds above the 1.1461–1.1473 zone and the trend line, with targets at 1.1536–1.1542.
Support and resistance price levels are thick red lines where movement may conclude. They are not sources of trading signals.
The Kijun-sen and Senkou Span B lines are Ichimoku indicator lines transferred to the hourly timeframe from the 4-hour timeframe. They are strong lines.
Extreme levels are thin red lines from which the price has previously rebounded. They are sources of trading signals.
Yellow lines indicate trend lines, trending channels, and any other technical patterns.
Indicator 1 on COT charts shows the size of the net position of each category of traders.

QUICK LINKS



















 Contact Us