
The EUR/USD currency pair traded lower again on Friday. On the last trading day of last week, a significant amount of diverse statistics was published, but in this article, we will not focus on a specific day but instead on the entire past week. So, the dollar had been rising for almost the whole previous week. Were there any grounds for this? On Monday, Tuesday, and Wednesday, there were no significant macroeconomic reports. On Thursday, positive Non-Farm Payrolls were released, which were immediately "overwhelmed" by a disappointing unemployment rate and downward revisions of the previous two months. On Friday, contradictory reports on business activity were released. So, what has caused the dollar to appreciate once again?
It is worth noting that for the last two months, there has been virtually no logic in the market movements. The dollar rises under any circumstances. It is no longer deterred by Trump's tariffs, "any kind of" shutdowns, the easing of monetary policy by the Federal Reserve, or the weakness of the U.S. labor market. As for the macroeconomic reports, we can hardly discuss them, as the market has typically ignored them. Thus, it remains extremely difficult to draw a conclusion that the dollar is rising logically.
Last week, market expectations rose sharply for the Fed's third consecutive easing in December. That is, "dovish" sentiment strengthened, yet the dollar continues to rise. Is there any logic in this? In our opinion, no. Therefore, the situation from last week has not changed significantly. The American currency is still appreciated at every opportunity, market volatility remains minimal (as shown in the illustration below), and the daily timeframe continues to show a flat trend.
Since the flat trend remains relevant and has been ongoing for several months, we continue to believe that it should serve as the basis for the analysis of the EUR/USD pair. The lower boundary of the sideways channel is at 1.1400, which means the dollar may strengthen to this level and even slightly below it, without any basis for doing so. We would not be surprised if the Fed lowered the rate again in December and the dollar still appreciated. However, the global upward trend continues, and any decline in the pair is merely a correction. Regardless of the duration of this correction, it remains a correction after which the main movement will continue. Thus, the key question at this time is: when will the correction end?
We should also remind you of the concept of "liquidity removal." Currently, there is an obvious minimum extremum of 1.1392 from August 1. Liquidity may be removed from this minimum for purchasing, after which the upward trend will resume. Thus, we fully anticipate a new drop of the pair, which, as before, will be entirely illogical from a fundamental perspective.
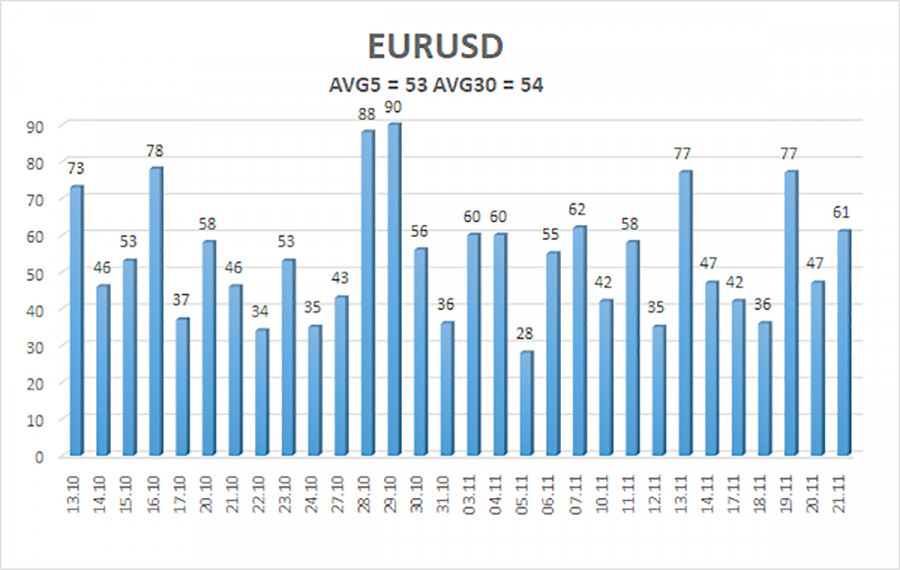
The average volatility of the EUR/USD currency pair over the last five trading days as of November 24 is 53 pips and is characterized as "medium-low." We expect the pair to trade between 1.1460 and 1.1566 on Monday. The upper channel of linear regression is directed downward, signaling a downward trend, but in reality, the flat trend continues on the daily timeframe. The CCI indicator entered the oversold area twice in October, which could provoke a new round of the upward trend beginning in 2025. In the near term, the indicator may enter the oversold area for the third time.
S1 – 1.1475
S2 – 1.1414
S3 – 1.1353
R1 – 1.1536
R2 – 1.1597
R3 – 1.1658
The EUR/USD pair has once again settled below the moving average, but an upward trend remains on all higher timeframes, and a flat trend has been ongoing on the daily timeframe for several months. The global fundamental backdrop continues to exert a strong influence on the U.S. dollar. Recently, the dollar has been rising, but the reasons for such movement may be purely technical. When the price is situated below the moving average, short positions can be considered with a target of 1.1460 based purely on technical grounds. Positions above the moving average remain relevant with a target of 1.1800 (the upper line of the flat trend on the daily timeframe).


 コンタクトする

