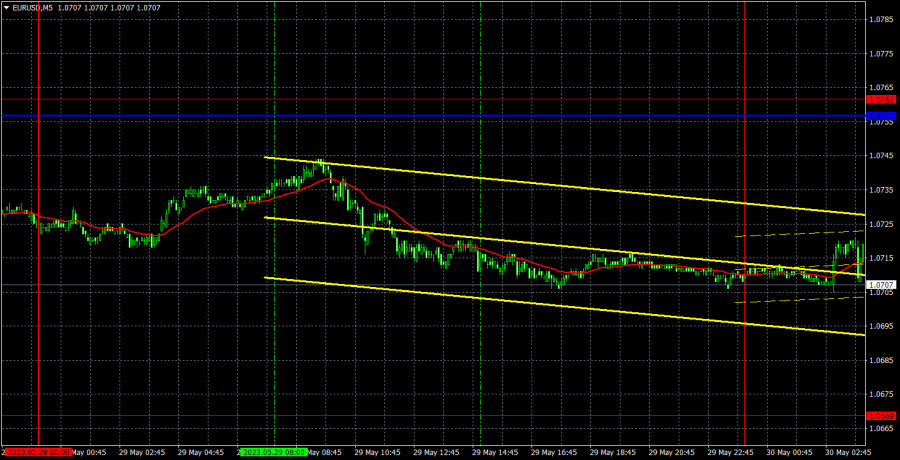
On Monday, the EUR/USD pair tried to continue its downward movement, but the volatility was so weak that trading was nearly impossible. There were no important macro data or any other events throughout the day that could have prompted traders to be more active. It was a holiday in the United States. Mondays often tend to be "semi-holidays." All of these factors combined resulted in volatility of less than 40 pips. However, even on Monday, the euro managed to edge down. Thus, the downward trend persists without raising any questions. We believe that the euro will fall in the medium term.
There were no trading signals on Monday. And perhaps it's for the best, considering the nature of the price movement, as it was very difficult to expect any profits. The price didn't even come close to important levels or lines.
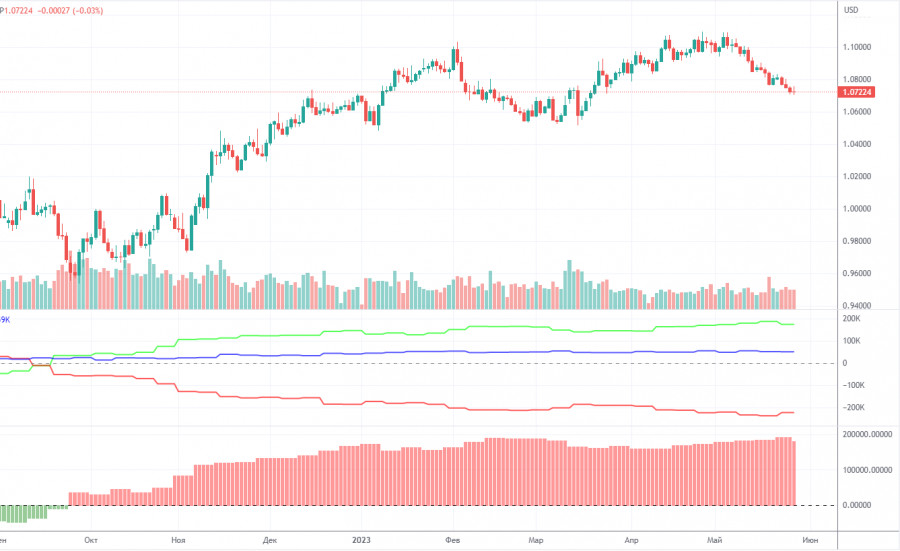
The COT report for May 23 was delivered on Friday. Over the past nine months, COT data has been in line with developments in the market. The net position (second indicator on the chart) has been on the rise since September 2022. The euro started to show strength approximately at the same time. Currently, the net non-commercial position is bullish and keeps growing further. Likewise, the euro is bullish.
Notably, we may assume by the extremely bullish net position that the uptrend may soon stop. The first indicator shows that, and the red and green lines are far away from each other, which is usually a sign that the end of the trend might be nearing. The euro attempted to go down several months ago, but those were just minor pullbacks. In the reporting week, long positions of non-commercial traders decreased by 8,600 and short positions rose by 4,700. The net position dropped by 13,300. The number of long positions exceeds that of short ones by 174,000, a rather big gap. A correction or a new downtrend has started. So, it is clear that the pair will be bearish even without COT reports.
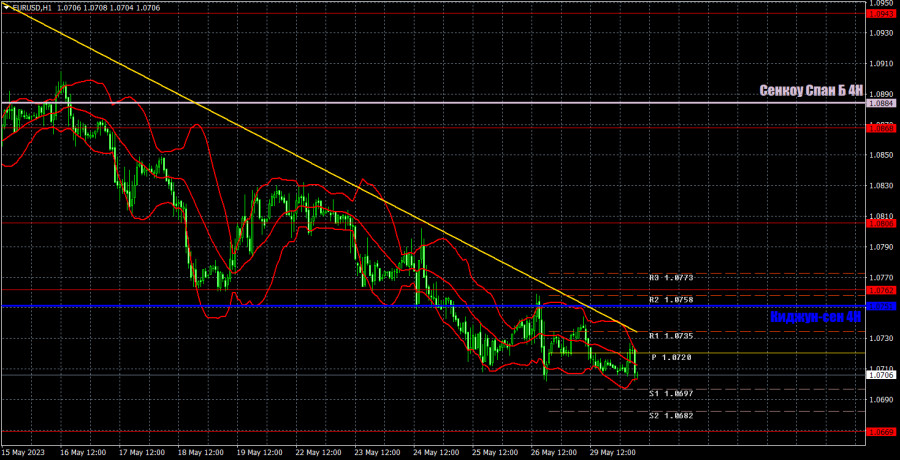
In the 1-hour time frame, the pair is still moving down. The trend is clear. The trendline is relevant. The price is below the Ichimoku lines. Nevertheless, the pair loses some 20-30 pips every day. That is, the trend is strong despite a sluggish fall every day. So, trades can be held for several days at least.
On May 30, trading levels are seen at 1.0537, 1.0581, 1.0658-1.0669, 1.0762, 1.0806, 1.0868, 1.0943, 1.1092, as well as the Senkou Span B (1.0884) and Kijun-sen (1.0751) lines. Ichimoku indicator lines can move intraday, which should be taken into account when determining trading signals. There are also support and resistance although no signals are made near these levels. Signals could be made when the price either breaks or bounces from these extreme levels. Do not forget to place Stop Loss at the breakeven point when the price goes by 15 pips in the right direction. In case of a false breakout, it could save you from possible losses.
Today, the macroeconomic calendar of the EU and the US is empty again. There are no minor reports or events. Therefore, we will unlikely see any strong intraday movements. There is a high likelihood of a flat market, or the pair could edge down.
Resistance/support - thick red lines, near which the trend may stop. They do not make trading signals.
Kijun-sen and Senkou Span B are the Ichimoku indicator lines moved to the hourly timeframe from the 4-hour timeframe. They are also strong lines.
Extreme levels are thin red lines, from which the price used to bounce earlier. They can produce trading signals.
Yellow lines are trend lines, trend channels, and other technical patterns.
Indicator 1 on the COT chart is the size of the net position of each trader category.
Indicator 2 on the COT chart is the size of the net position for the Non-commercial group of traders.

فوری رابطے


 ہم سے رابطہ کریں

