Analiza rynku

Przeglądy analityczne ForexMart dostarczają aktualnych informacji na temat rynku finansowego. Przeglądy te zawierają informacje o trendach rynkowych, prognozach finansowych, raportach ekonomicznych i wiadomościach politycznych, które mają wpływ na rynek.

Disclaimer:  ForexMart nie udziela rekomendacji inwestycyjnych, a dostarczone materiały analityczne nie gwarantują przyszłych wyników.

How to Trade the GBP/USD Currency Pair on November 7? Simple Tips and Trade Analysis for Beginners
22:37 2025-11-06 UTC--6
Analiza kursów walut

Trade Analysis for Thursday:

1H Chart of GBP/USD

The GBP/USD pair also traded higher on Thursday, which makes little sense. Recall that the British currency had been declining for more than a month and was falling more sharply than the euro, often without any justification. However, yesterday, following the Bank of England's meeting, which surprised traders, the pound sterling rose. The British central bank left the key rate unchanged, but this decision was not unanimous among the bank officials. We could even say it was "on the edge." Four members of the Monetary Policy Committee voted for a rate cut while five voted to keep it unchanged. Thus, literally one vote could have led to a rate cut. This event indicates a more "dovish" stance from the central bank than was anticipated. Therefore, the British currency had every reason to continue its decline yesterday. However, as we mentioned, there is currently no connection between the movements of the pair and events/reports, which is why we saw a rise within the prevailing downward trend on the hourly timeframe and within a correction/flat on the daily timeframe.

5M Chart of GBP/USD

analytics690d75b63f5c9.jpg

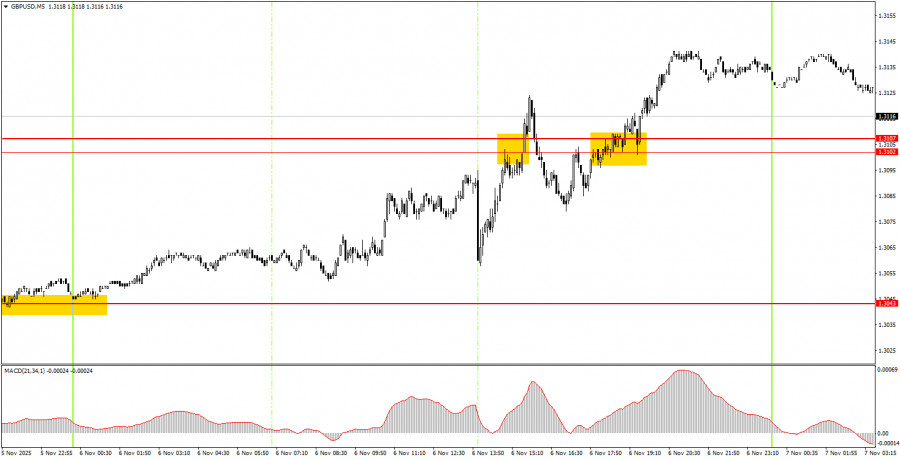
On the 5-minute timeframe, several trade signals were formed throughout Thursday, although the pair traded chaotically due to the significance of the Bank of England meeting. However, the best buy signal was formed earlier in the night. The price breached the 1.3043 level, after which, during the American session, it approached the area of 1.3102-1.3107, where profits could already have been taken. Later, two more trade signals were formed: one for a sale (false) and one for a buy (true).

How to Trade on Friday:

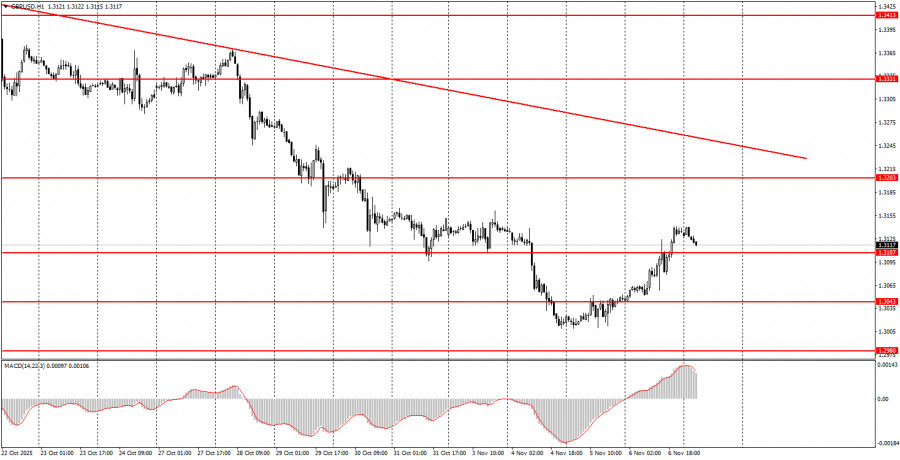
On the hourly timeframe, the GBP/USD pair continues to form a new downward trend. The pound sterling is once again declining for absolutely any reasons. As we have already stated, there are no grounds for prolonged dollar growth, so we expect movement only to the north in the medium term. However, the flat factor continues to pull the pair down in the long term, which is an absolutely illogical development.

On Friday, novice traders may remain in long positions after breaching the 1.3102-1.3107 area, targeting 1.3203. If the pair establishes itself below this area today, short positions with a target of 1.3043 will become relevant.

On the 5-minute timeframe, you can currently trade at the following levels: 1.2913, 1.2980-1.2993, 1.3043, 1.3102-1.3107, 1.3203-1.3211, 1.3259, 1.3329-1.3331, 1.3413-1.3421, 1.3466-1.3475, 1.3529-1.3543, and 1.3574-1.3590. No significant events or reports are scheduled for Friday in the UK, while in the U.S., only the consumer sentiment index will be released, instead of Non-Farm Payrolls and the unemployment rate.

Key Principles of My Trading System:

  1. The strength of the signal is considered based on the time taken to form the signal (bounce or breach of a level). The less time taken, the stronger the signal.
  2. If two or more trades have been opened around a certain level based on false signals, all subsequent signals from that level should be ignored.
  3. In a flat market, any pair can create numerous false signals or may not form them at all. In any case, it's best to stop trading at the first signs of a flat.
  4. Trading deals are opened during the period between the start of the European session and the middle of the American session, after which all deals should be closed manually.
  5. On the hourly timeframe, it is preferable to trade based on signals from the MACD indicator only when there is good volatility and a trend that is confirmed by a trend line or trend channel.
  6. If two levels are too close to each other (between 5 and 20 pips), they should be treated as an area of support or resistance.
  7. After a 20-pip move in the right direction, a Stop Loss should be set to breakeven.

What the Charts Show:

  • Support and resistance price levels are targets for opening buy or sell positions. Take Profit levels can be placed around them.
  • Red lines indicate trend channels or trend lines, reflecting the current trend and indicating the preferred trading direction.
  • The MACD indicator (14,22,3) — histogram and signal line — is a supplementary indicator that can also be used as a source of signals.

Important announcements and reports (always available in the news calendar) can significantly impact the movement of the currency pair. Therefore, during their release, it is recommended to trade with maximum caution or to exit the market to avoid sharp reversals against the preceding movement.

Beginners trading on the Forex market should remember that not every trade can be profitable. Developing a clear strategy and money management is key to long-term success in trading.


Opinie

ForexMart is authorized and regulated in various jurisdictions.

(Reg No.23071, IBC 2015) with a registered office at First Floor, SVG Teachers Co-operative Credit Union Limited Uptown Building, Corner of James and Middle Street, Kingstown, Saint Vincent and the Grenadines

Restricted Regions: the United States of America, North Korea, Sudan, Syria and some other regions.


© 2015-2025 Tradomart SV Ltd.
Top Top
Ostrzeżenie o ryzyku:
Kontrakty CFD są złożonymi instrumentami i wiążą się z wysokim ryzykiem szybkiej utraty pieniędzy z powodu dźwigni finansowej. 71.71% kont inwestorów detalicznych traci pieniądze podczas handlu kontraktami CFD. Zastanów się, czy rozumiesz, jak działają kontrakty CFD i czy możesz sobie pozwolić na wysokie ryzyko utraty pieniędzy.