Nejcennější evropská společnost SAP upozornila na zvyšující se nejistotu v souvislosti s globální obchodní politikou Spojených států. Německý softwarový gigant uvedl, že napětí ohledně celních sporů a geopolitických vztahů brzdí rozhodování zákazníků, zejména na americkém trhu, který je pro SAP jedním z nejdůležitějších. Přesto však vedení společnosti zachovává mírně optimistický výhled do budoucna, a to i díky čerstvě oznámené obchodní dohodě mezi Spojenými státy a Japonskem, která podle SAP přináší „určitou naději“.
Finanční ředitel společnosti Dominik Asam ve středečním rozhovoru pro CNBC upozornil, že nejisté prostředí v USA zpomaluje rozhodovací procesy u zákazníků, zejména ve veřejném sektoru a mezi velkými výrobními podniky s globálními dodavatelskými řetězci. „Některé významné obchody byly odloženy na začátek posledního čtvrtletí. Nejde o zrušení, ale schvalovací procesy se přesunuly na vyšší úroveň kvůli zvýšené nejistotě,“ vysvětlil Asam.
Dodal, že úspěšné zvládnutí situace bude záviset především na rychlosti, s jakou se geopolitické napětí uklidní. SAP tak zatím nedělá žádné dramatické závěry, ale připouští, že bez zklidnění mezinárodního prostředí může být ohrožen výhled růstu na rok 2025.

Pozitivní signál představuje nedávná dohoda Spojených států s Japonskem, která stanovila 15% clo na dovoz z Japonska do USA a zároveň zahrnuje japonské investice ve výši 550 miliard dolarů do americké ekonomiky. SAP tuto dohodu vnímá jako první krok ke zmírnění napětí a obnově důvěry v obchodní prostředí.
„Vývoj v Japonsku nám samozřejmě dává určitou naději, ale je ještě příliš brzy na spekulace,“ uvedl Asam s tím, že dohoda může sloužit jako vzor i pro budoucí vyjednávání mezi USA a Evropskou unií. Stav těchto jednání však zůstává nejistý a jakýkoli rámcový kompromis je zatím v nedohlednu.
Navzdory geopolitickým komplikacím SAP oznámil meziroční nárůst tržeb o 9 % na 9,03 miliardy eur za druhé čtvrtletí. Provozní zisk dosáhl 2,57 miliardy eur, což mírně překonalo očekávání trhu. Společnost také potvrdila svůj výhled na celý rok 2025, i když varovala, že „dynamické prostředí snižuje viditelnost“ a zvyšuje rizika.
Klíčový ukazatel – objem zakázek v oblasti cloudových služeb – vzrostl o 28 % při konstantním směnném kurzu na 18,05 miliardy eur. Tento výsledek analytici z Deutsche Bank označili za „silný signál“, že SAP si i přes obtíže udržuje růstové momentum. Ve své zprávě vyzdvihli silnou produktovou nabídku, důsledný rozvoj AI technologií a dlouhodobou strategii migrace do cloudu.
Generální ředitel Christian Klein dodal, že SAP čerpá výhody i z rostoucích evropských výdajů na národní bezpečnost, které zvyšují poptávku po digitálních řešeních v obranném průmyslu – což je pro firmu nový a dynamicky rostoucí segment.
Zatímco provozní výsledky byly silné, firma čelila negativnímu vlivu výkyvů měnových kurzů, zejména oslabujícího amerického dolaru vůči euru. SAP varoval, že právě měnové přepočty povedou ve třetím čtvrtletí k poklesu růstu tržeb z cloudu o zhruba 5 %, pokud zůstanou kurzy na úrovni z konce června.
Analytici z TD Cowen a Piper Sandler na základě těchto rizik snížili cílové ceny akcií SAP. Akcie samotné ve středu na frankfurtské burze klesly o 3,5 %, což odráží smíšené přijetí výsledků investory – silný růst v cloudu a solidní zisk nestačily překrýt obavy z budoucnosti obchodních vztahů a měnových vlivů.
SAP SE (SAP)
Společnost SAP v posledních dvou letech transformovala svůj byznys směrem k cloudovým službám a umělé inteligenci. Nyní většinu příjmů generuje právě v cloudu a její strategie stojí na tom, jak využít své obrovské databáze z oblastí financí, obchodu a logistiky ke zvyšování efektivity podniků po celém světě. Mezi nové významné zákazníky přibyla ve druhém čtvrtletí například společnost Alibaba, což potvrzuje globální dosah a konkurenceschopnost SAP.
Ačkoli firma čelí výzvám, její technologický základ a dlouhodobá orientace na inovace jí pomáhají udržovat pozici nejhodnotnější veřejně obchodované firmy v Evropě. Překonala tím nejen francouzského luxusního giganta LVMH, ale i dánskou farmaceutickou společnost Novo Nordisk.
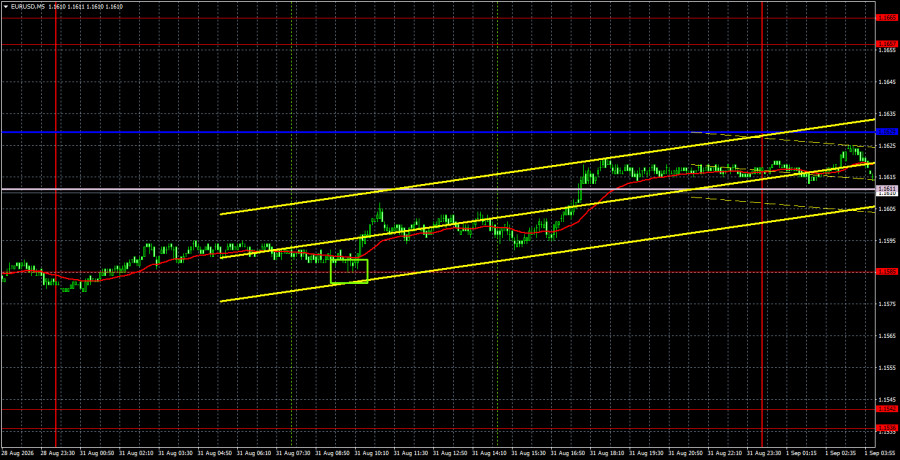
The EUR/USD currency pair slightly rebounded on Monday, suggesting a correction against the previous downward trend rather than a new downward movement. The only event of the day was the publication of Germany's inflation report. The consumer price index increased in August to 2.9%, against forecasts of 3.0%. Thus, inflation rose, but at a slower pace than expected. Traders will not base their conclusions solely on this report but rather on the overall inflation data for the Eurozone, which will be published today. If inflation accelerates to forecasted levels or higher, it will provide substantial grounds to anticipate the European Central Bank's monetary policy tightening as early as September.
It's worth reminding that the ECB is not constrained in its actions. If inflation continues to rise, the ECB will comfortably raise rates for the second time. In the U.S., the labor market is now a restraining factor, having declined for four consecutive months and likely to show another unsatisfactory number on Friday. Additionally, annual Nonfarm Payrolls have been revised downward, leading to skepticism about Warsh's team being ready to vote to tighten policy in September.
From a technical perspective, the pair has initiated a new downward trend after breaching the ascending trend line, as well as the Senkou Span B and Kijun-sen lines, which is clearly visible on the hourly timeframe. Therefore, the pair may continue to decline in the near future. A significant amount of important data will be published in both the U.S. and the Eurozone this week, so the pair may frequently change direction.
On the 5-minute timeframe, a relatively weak buy signal was formed on Monday. During the European trading session, the price rebounded from 1.1585, allowing it to advance toward the Senkou Span B and Kijun-sen lines. Thus, traders could earn a few dozen pips even in Monday's low-volatility environment.
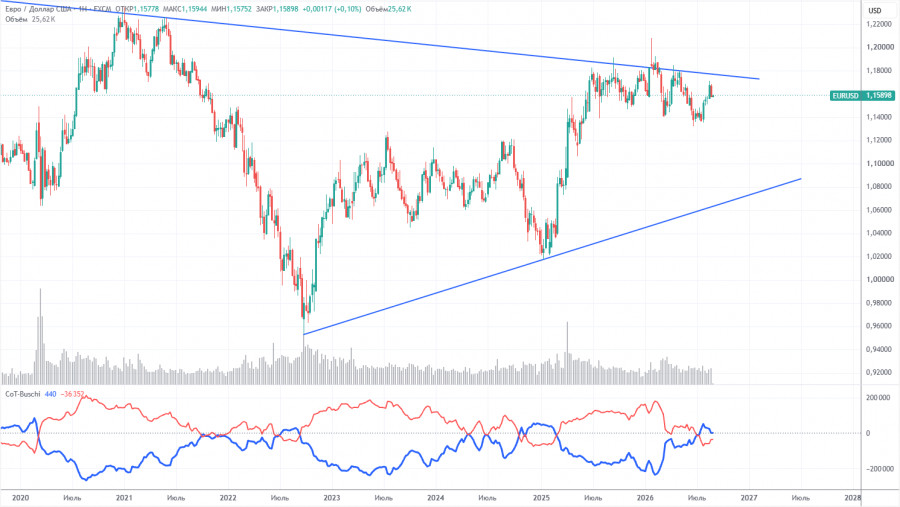
The latest COT report is dated August 25. In the weekly timeframe illustration, it is clear that the net position of non-commercial traders has turned "bearish" and has significantly decreased in 2026 due to geopolitical events. Traders have been getting rid of the European currency in favor of the U.S. dollar in recent months. Donald Trump's policy remains unchanged, but the dollar once served as a "reserve currency."
We still do not see any fundamental factors that would strengthen the American currency. The war in the Middle East made the dollar temporarily very attractive, but once this factor reaches its "expiration date," everything will return to normal. This process may have already concluded. In the long term, the euro may fall as low as the 1.08$ level (trend line), but the upward trend will remain valid. Over the last months of dollar growth, the pair has not approached this line significantly.
The positions of the red and blue lines of the indicator suggest an approximate parity between bulls and bears. Over the last reporting week, the number of longs in the "Non-commercial" group increased by 2,700, while the number of shorts decreased by 20,000. Consequently, the net position grew by 22,700 contracts during the week.
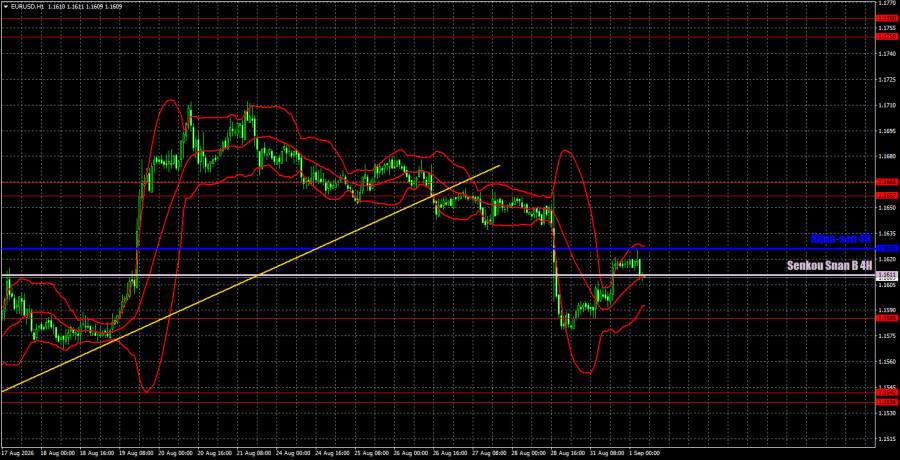
On the hourly timeframe, the pair interrupted its upward trend on Friday. The situation in the Middle East remains tense and has not improved, but this is not enough for a new, strong rise in the dollar. Kevin Warsh's speech and the annual Nonfarm Payrolls supported the dollar, but we do not see any significant reasons for optimism or excellent prospects for the American currency. This week, U.S. data could halt the dollar's rise.
For September 1, we highlight the following levels for trading — 1.1234, 1.1274, 1.1362-1.1368, 1.1461-1.1473, 1.1536-1.1542, 1.1585, 1.1657-1.1665, 1.1750-1.1760, 1.1786, 1.1830-1.1837, as well as the Senkou Span B line (1.1611) and Kijun-sen (1.1626). The lines of the Ichimoku indicator may move throughout the day, which should be taken into account when determining trading signals. Don't forget to set a stop-loss order to break even if the price moves 15 pips in the right direction. This will protect against potential losses if the signal proves false.
On Tuesday, a significant inflation report for the Eurozone will be released, which could influence the ECB's decision on rates in September. In the U.S., important reports on job openings and business activity in the manufacturing sector will also be published. The market may react to this data in the second half of the day.
Today, traders may consider short positions targeting 1.1536-1.1542 if price rebounds from the 1.1611-1.1626 area. A consolidation above the Ichimoku indicator lines will allow opening long positions targeting 1.1657-1.1665 and above.
Price levels (areas) of support and resistance are thick red lines where movement may conclude. They are not sources of trading signals.
The Kijun-sen and Senkou Span B lines are Ichimoku indicator lines transferred to the hourly timeframe from the 4-hour timeframe. They are strong lines.
Extreme levels are thin red lines from which the price has previously rebounded. They are sources of trading signals.
Yellow lines indicate trend lines, trending channels, and any other technical patterns.
Indicator 1 on COT charts shows the size of the net position of each category of traders.





















 コンタクトする